Application
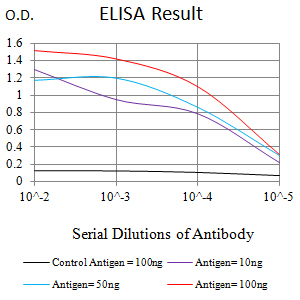
Figure 1:Black line: Control Antigen (100 ng);Purple line: Antigen (10ng); Blue line: Antigen (50 ng); Red line:Antigen (100 ng)Application
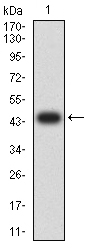
Figure 2:Western blot analysis using CD80 mAb against human CD80 (AA: 35-288) recombinant protein. (Expected MW is 45 kDa)Application
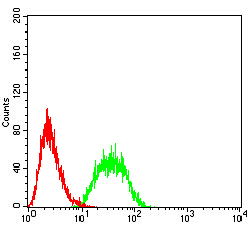
Figure 3:Flow cytometric analysis of HL-60 cells using CD80 mouse mAb (green) and negative control (red).Application
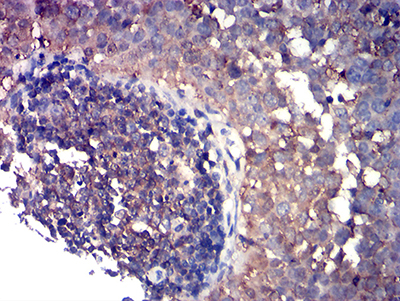
Figure 4:Immunohistochemical analysis of paraffin-embedded cervical cancer tissues using CD80 mouse mAb with DAB staining.| Product Name | CD80 |
|---|---|
| Antibody Type | Primary Antibodies |
| Antigen Alias | B7; BB1; B7-1; B7.1; LAB7; CD28LG; CD28LG1 |
| Immunogen | Purified recombinant fragment of human CD80 (AA: 35-288) expressed in E. Coli. |
| Clonality | Monoclonal |
|---|---|
| Host Species | Unknow |
| Tested Applications | WBIHCFCMICC/IF |
| WB:1:250~1:1000 IHC:1:20~1:100 ICC/IF:1:100~1:200 Notes:Optimal dilutions/concentrations should be determined by the researcher. |
|
| Species Reactivity | Human |
| Alternative Names | B7 BB1 B7-1 B7.1 LAB7 CD28LG CD28LG1 |
|---|---|
| Molecular Weight(MW) | 33kDa |
| Entrez Gene | 941 |
|---|
Application
Figure 1:Black line: Control Antigen (100 ng);Purple line: Antigen (10ng); Blue line: Antigen (50 ng); Red line:Antigen (100 ng)
Application
Figure 2:Western blot analysis using CD80 mAb against human CD80 (AA: 35-288) recombinant protein. (Expected MW is 45 kDa)
Application
Figure 3:Flow cytometric analysis of HL-60 cells using CD80 mouse mAb (green) and negative control (red).
Application
Figure 4:Immunohistochemical analysis of paraffin-embedded cervical cancer tissues using CD80 mouse mAb with DAB staining.| Application Notes | WB:1:250~1:1000 IHC:1:20~1:100 ICC/IF:1:100~1:200 Notes:Optimal dilutions/concentrations should be determined by the researcher. |
|---|
| Form | Purified antibody in PBS with 0.05% sodium azide |
|---|---|
| Storage Instructions | 4℃; -20℃ for long term storage |


