


Application
Figure 1: Western blot analysis using beta-Actin mouse mAb against NIH/3T3 (1), Jurkat (2), Hela (3), CHO (4), PC12 (5), HEK293 (6), COS (7), A549 (8) and MCF-7 (9) cell lysate.Application
Figure 2: Confocal immunofluorescence analysis of SKBR-3 (left) and A549 (right) cells using beta Actin mouse mAb (red, the secondary Ab is Cy3-Goat anti mouse IgG). Blue: DRAQ5 fluorescent DNA dye.Application
Figure 3: Flow cytometric analysis of MCF-7 cells using beta Actin mouse mAb (right) and negative control (left).WB
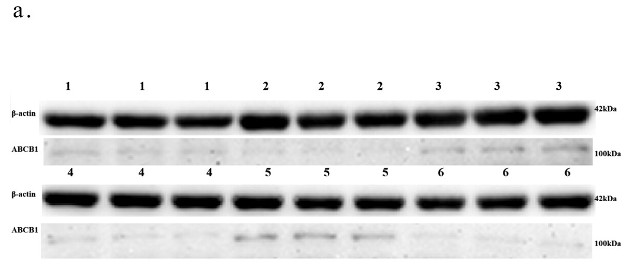
Relative expression level of the ABCB1 protein. In Figure, 1,3,5 represent the AMI group, 2,4,6 represent the control.WB
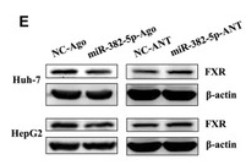
(E) Representative immunoblot of FXR protein level in HepG2 or Huh-7 cell transfected with miR-382-5p-Ago (100 nM), miR-382-5p-ANT (200 nM) or corresponding control for 36 h with the treatment of GW4064 (2 μM) for 24 h till the harvest, normalized to β-actin protein level.WB
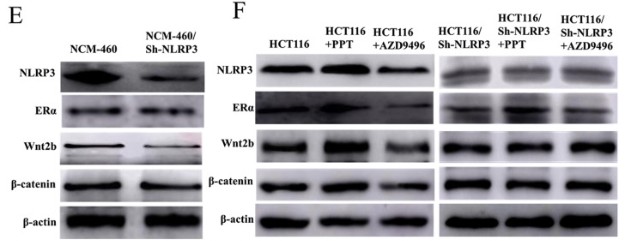
(E-F) Western blot results of NLRP3, ER, Wnt2b, and β-catenin different cells.| Product Name | beta-Actin |
|---|---|
| Antibody Type | Primary Antibodies |
| Immunogen | Synthetic peptide corresponding to amino-terminal residues of human beta-Actin, conjugated to KLH. |
| Clonality | Monoclonal |
|---|---|
| Host Species | Unknow |
| Tested Applications | FCMICCICC/IFWB |
| WB:1:250~1:1000 ICC:1:100~1:200 ICC/IF:1:100~1:200 Notes:Optimal dilutions/concentrations should be determined by the researcher. |
|
| Species Reactivity | HamsterHumanMonkeyMouseRat |
| Alternative Names | PS1TP5BP1 ACTB |
|---|---|
| Molecular Weight(MW) | 42kDa |
| Entrez Gene | 60 |
|---|
Application
Figure 1: Western blot analysis using beta-Actin mouse mAb against NIH/3T3 (1), Jurkat (2), Hela (3), CHO (4), PC12 (5), HEK293 (6), COS (7), A549 (8) and MCF-7 (9) cell lysate.
Application
Figure 2: Confocal immunofluorescence analysis of SKBR-3 (left) and A549 (right) cells using beta Actin mouse mAb (red, the secondary Ab is Cy3-Goat anti mouse IgG). Blue: DRAQ5 fluorescent DNA dye.
Application
Figure 3: Flow cytometric analysis of MCF-7 cells using beta Actin mouse mAb (right) and negative control (left).
WB
Relative expression level of the ABCB1 protein. In Figure, 1,3,5 represent the AMI group, 2,4,6 represent the control.
WB
(E) Representative immunoblot of FXR protein level in HepG2 or Huh-7 cell transfected with miR-382-5p-Ago (100 nM), miR-382-5p-ANT (200 nM) or corresponding control for 36 h with the treatment of GW4064 (2 μM) for 24 h till the harvest, normalized to β-actin protein level.
WB
(E-F) Western blot results of NLRP3, ER, Wnt2b, and β-catenin different cells.| Application Notes | WB:1:250~1:1000 ICC:1:100~1:200 ICC/IF:1:100~1:200 Notes:Optimal dilutions/concentrations should be determined by the researcher. |
|---|
| Form | Ascitic fluid containing 0.03% sodium azide. |
|---|---|
| Storage Instructions | 4℃; -20℃ for long term storage |


