
Application
Figure 1: Immunofluorescence analysis of peripheral blood T cells using CD3 mouse mAb (A) and flow cytometric analysis of eripheral blood T cells using CD3 mouse mAb (B).IF
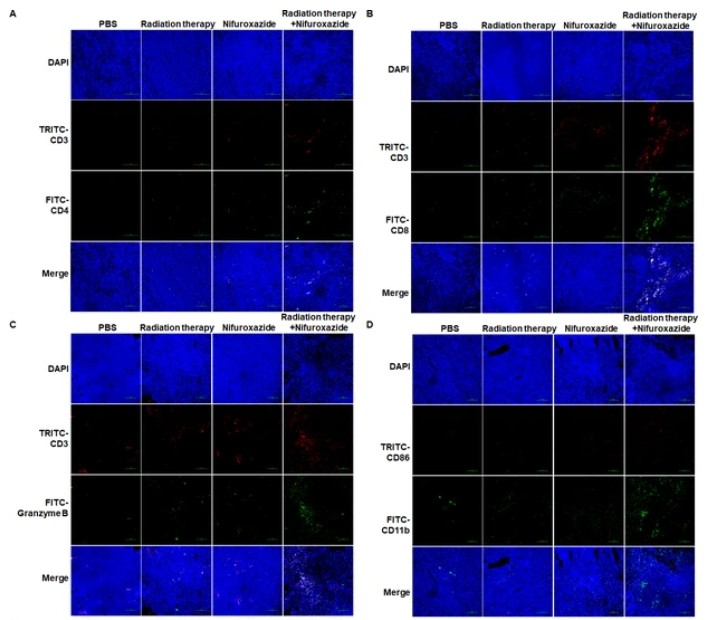
(A–C) Different isoforms of T lymphocytes infiltration in tumor tissues detected by immunofluorescence assay. (D) M1 macrophage infiltration in tumor tissues detected by immunofluorescence assay.IF
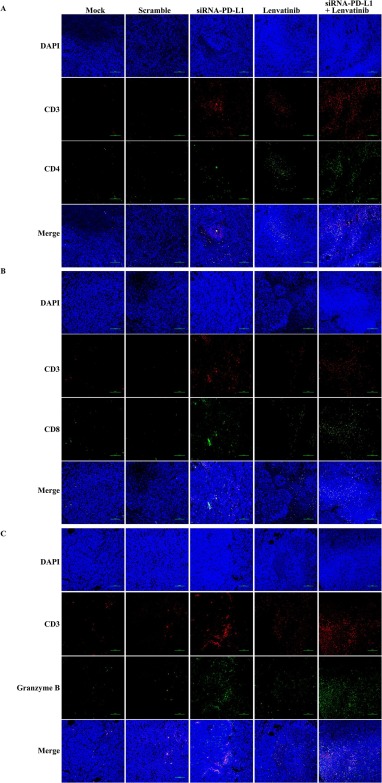
The effect of the combination treatment on T-lymphocyte infiltration in the tumor tissue. The expression of CD4+ (A) and the CD8+ (B) T cells in the tumor tissue after treatment with different therapies for 14 days. C. The expression of Granzyme in the tumor tissue in each group after treatment for 14 days.IF
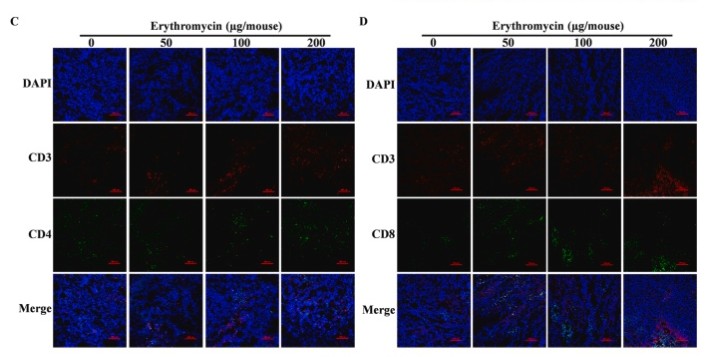
(C) Infiltration of CD4+ T lymphocytes. (D) Infiltration of CD8+ T lymphocytes in tumor tissues.IF
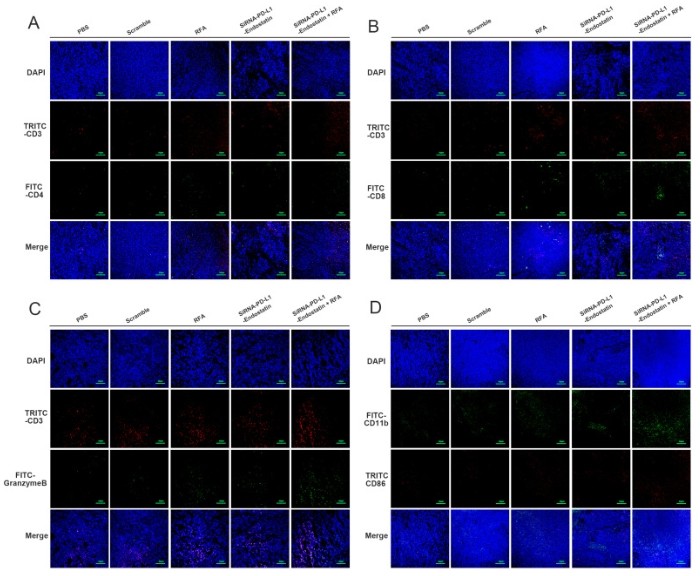
A-D. Immunofluorescence was used to detect the infiltration of immune cells in tumour tissue.| Product Name | CD3 |
|---|---|
| Antibody Type | Primary Antibodies |
| Immunogen | Purified recombinant fragment of human CD3 expressed in E. Coli. |
| Clonality | Monoclonal |
|---|---|
| Isotype | IgG1 |
| Host Species | Mouse |
| Tested Applications | ICCICC/IFIF |
| ICC:1:100~1:200 ICC/IF:1:100~1:200 Notes:Optimal dilutions/concentrations should be determined by the researcher. |
|
| Species Reactivity | Human |
| Purification | Affinity purified |
| Alternative Names | T3Z CD3H CD3Q CD3Z TCRZ CD3-ZETA CD247 |
|---|---|
| Molecular Weight(MW) | N/A |
| Entrez Gene | 919 |
|---|
Application
Figure 1: Immunofluorescence analysis of peripheral blood T cells using CD3 mouse mAb (A) and flow cytometric analysis of eripheral blood T cells using CD3 mouse mAb (B).
IF
(A–C) Different isoforms of T lymphocytes infiltration in tumor tissues detected by immunofluorescence assay. (D) M1 macrophage infiltration in tumor tissues detected by immunofluorescence assay.
IF
The effect of the combination treatment on T-lymphocyte infiltration in the tumor tissue. The expression of CD4+ (A) and the CD8+ (B) T cells in the tumor tissue after treatment with different therapies for 14 days. C. The expression of Granzyme in the tumor tissue in each group after treatment for 14 days.
IF
(C) Infiltration of CD4+ T lymphocytes. (D) Infiltration of CD8+ T lymphocytes in tumor tissues.
IF
A-D. Immunofluorescence was used to detect the infiltration of immune cells in tumour tissue.| Application Notes | ICC:1:100~1:200 ICC/IF:1:100~1:200 Notes:Optimal dilutions/concentrations should be determined by the researcher. |
|---|
| Form | Purified antibody in PBS containing 0.03% sodium azide. |
|---|---|
| Storage Instructions | 4℃; -20℃ for long term storage |


