WB
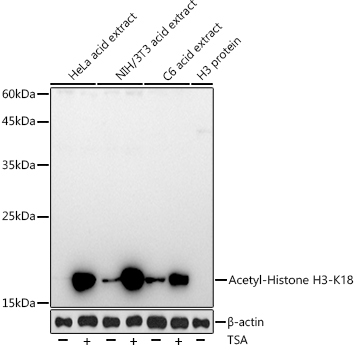
Western blot analysis of various lysates using Acetyl-Histone H3-K18 Rabbit mAb at 1:1000 dilution. HeLa cells and NIH/3T3 cells and C6 cells were treated with TSA (1 uM) at 37℃ for 18 hours. Secondary antibody: HRP-conjugated Goat anti-Rabbit IgG (H+L) (AS014) at 1:10000 dilution. Lysates/proteins: 25μg per lane. Blocking buffer: 3% nonfat dry milk in TBST. Detection: ECL Basic Kit. Exposure time: 180s.DB
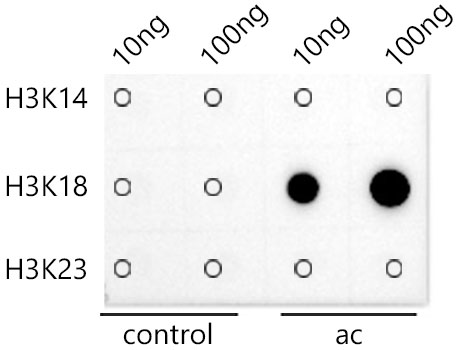
Dot-blot analysis of all sorts of peptides using Acetyl-Histone H3-K18 Rabbit mAb at 1:100000 dilution.IHC
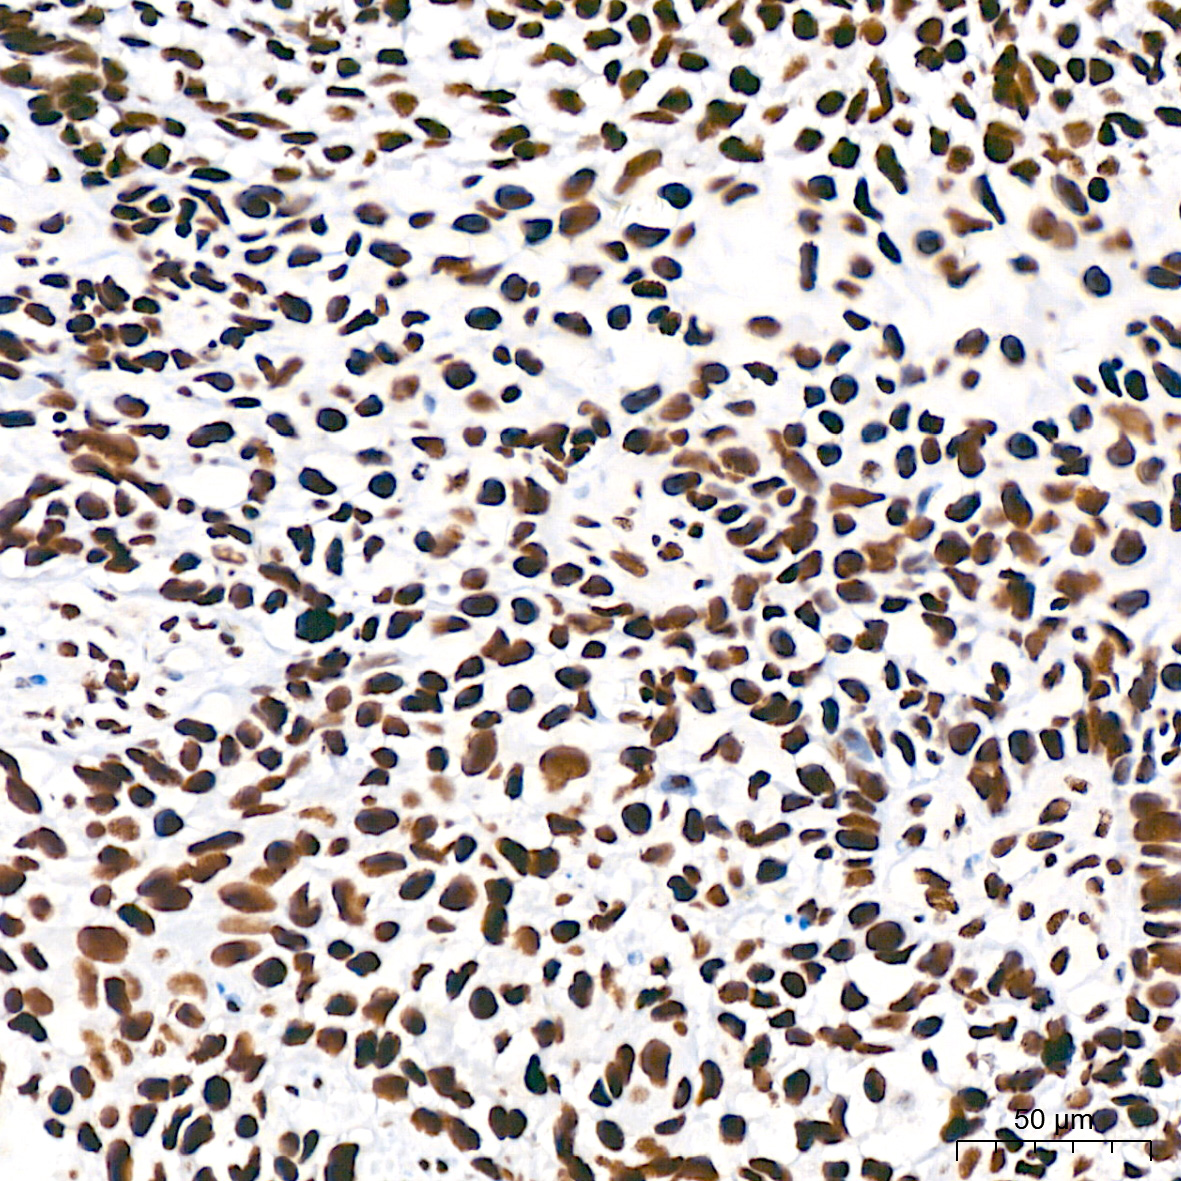
Immunohistochemistry analysis of paraffin-embedded Human cervix cancer tissue using Acetyl-Histone H3-K18 Rabbit mAb at a dilution of 1:200 (40x lens). High pressure antigen retrieval performed with 0.01M Citrate buffer (pH 6.0) prior to IHC staining.IHC
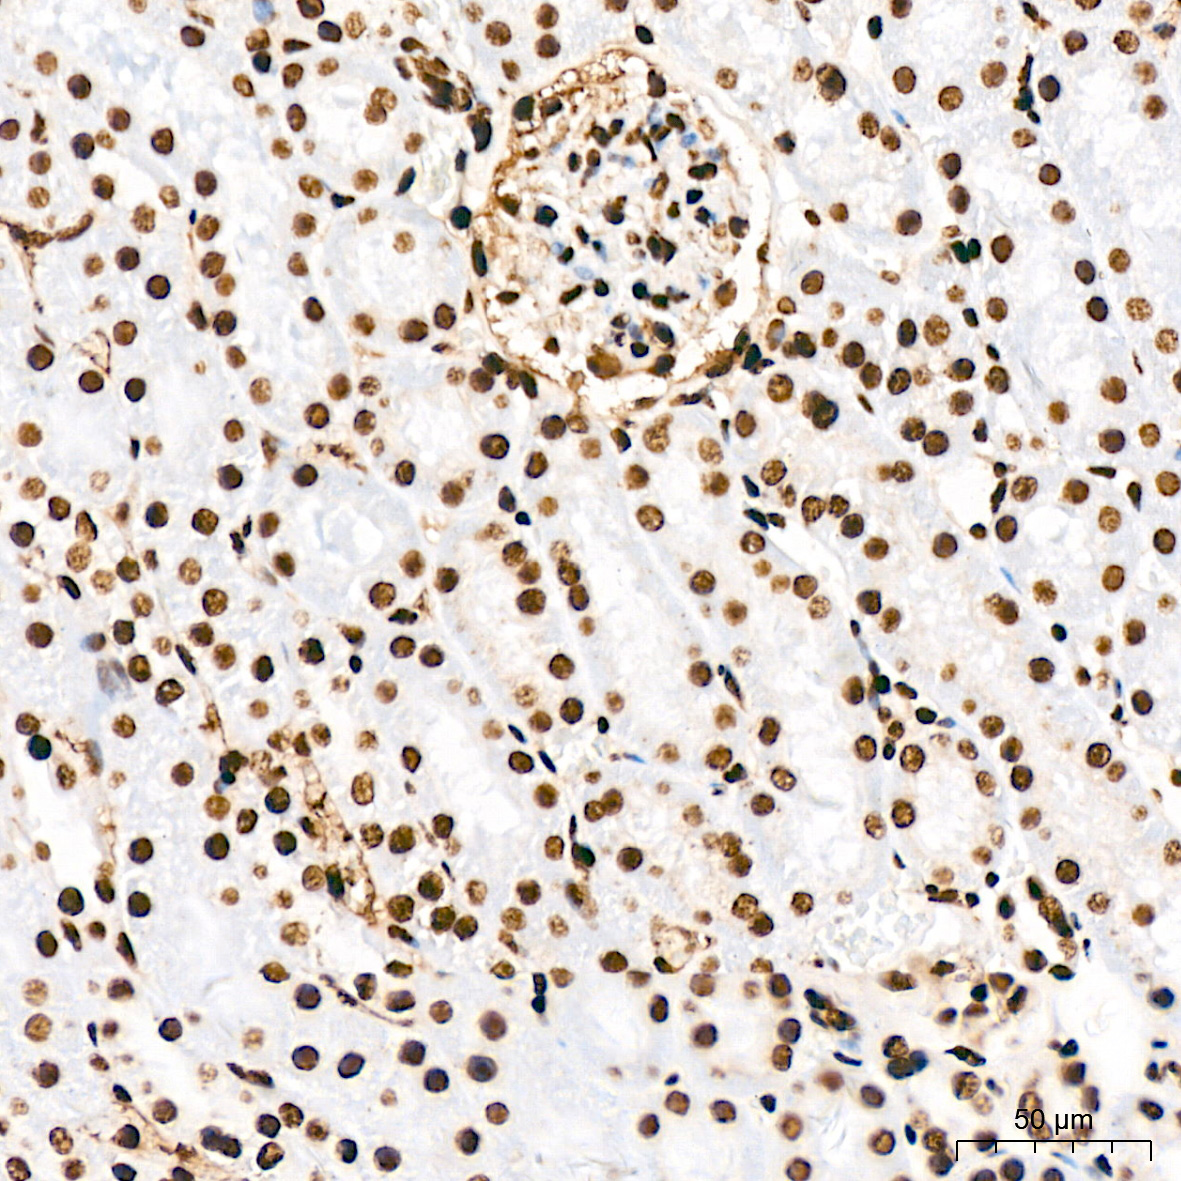
Immunohistochemistry analysis of paraffin-embedded Mouse kidney tissue using Acetyl-Histone H3-K18 Rabbit mAb at a dilution of 1:200 (40x lens). High pressure antigen retrieval performed with 0.01M Citrate buffer (pH 6.0) prior to IHC staining.IHC
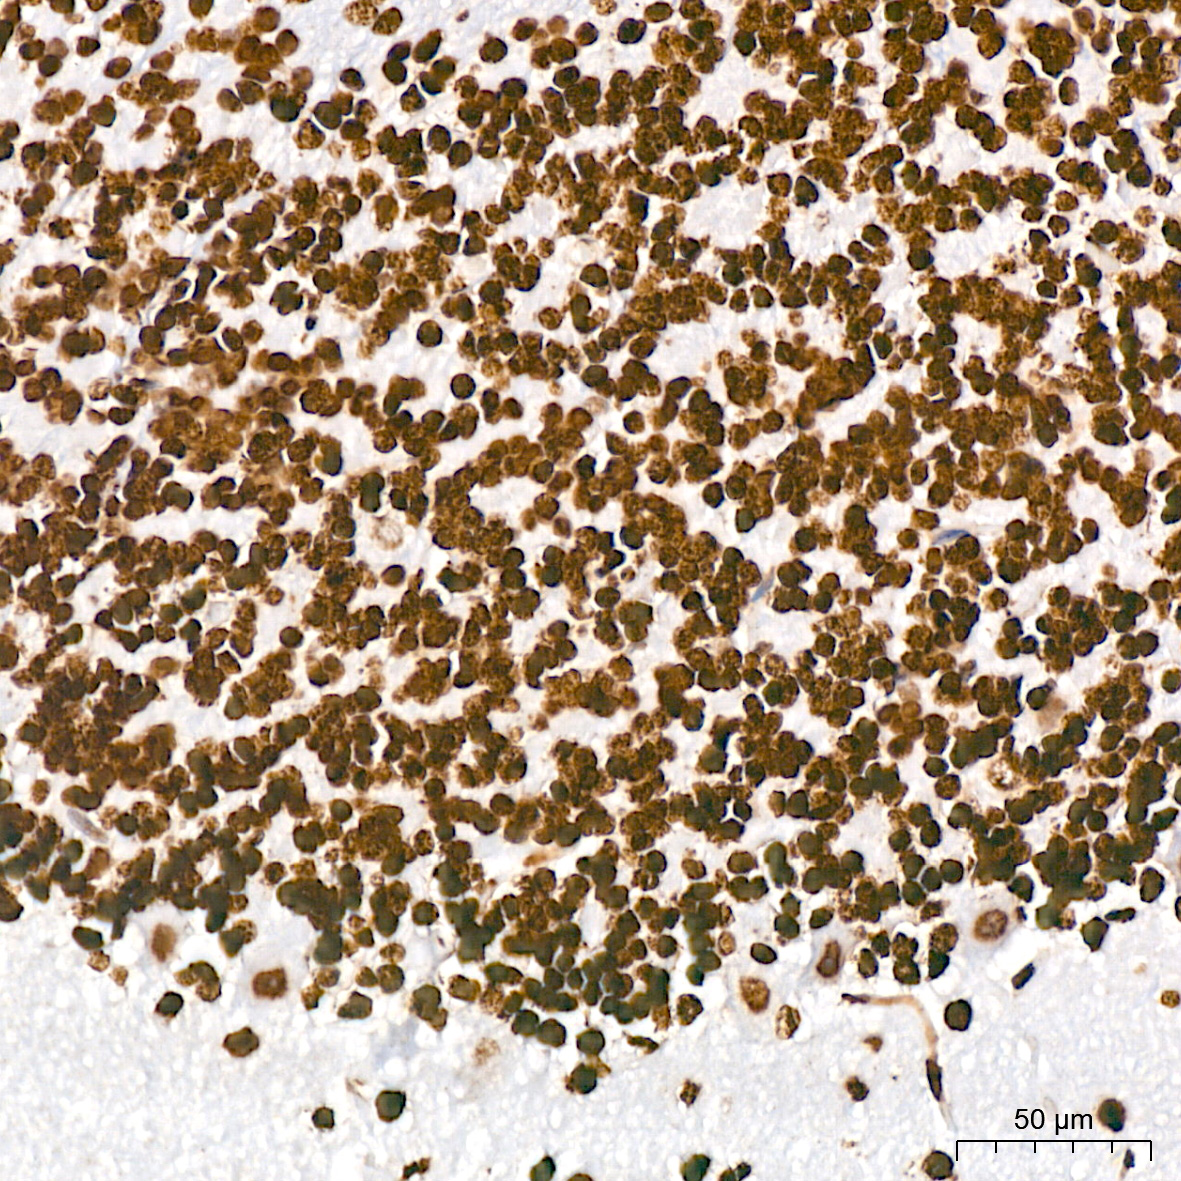
Immunohistochemistry analysis of paraffin-embedded Rat brain tissue using Acetyl-Histone H3-K18 Rabbit mAb at a dilution of 1:200 (40x lens). High pressure antigen retrieval performed with 0.01M Citrate buffer (pH 6.0) prior to IHC staining.CHIP
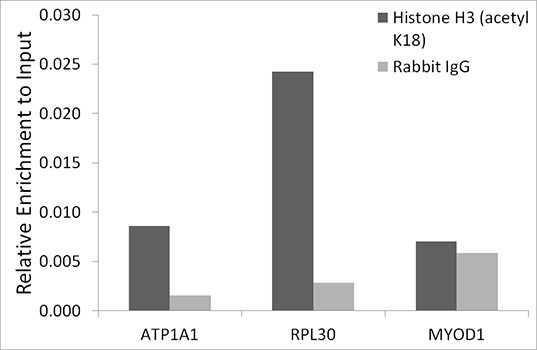
Chromatin immunoprecipitation analysis of extracts of HeLa cells, using Acetyl-Histone H3-K18 Rabbit mAb and rabbit IgG.The amount of immunoprecipitated DNA was checked by quantitative PCR. Histogram was constructed by the ratios of the immunoprecipitated DNA to the input.CHIP
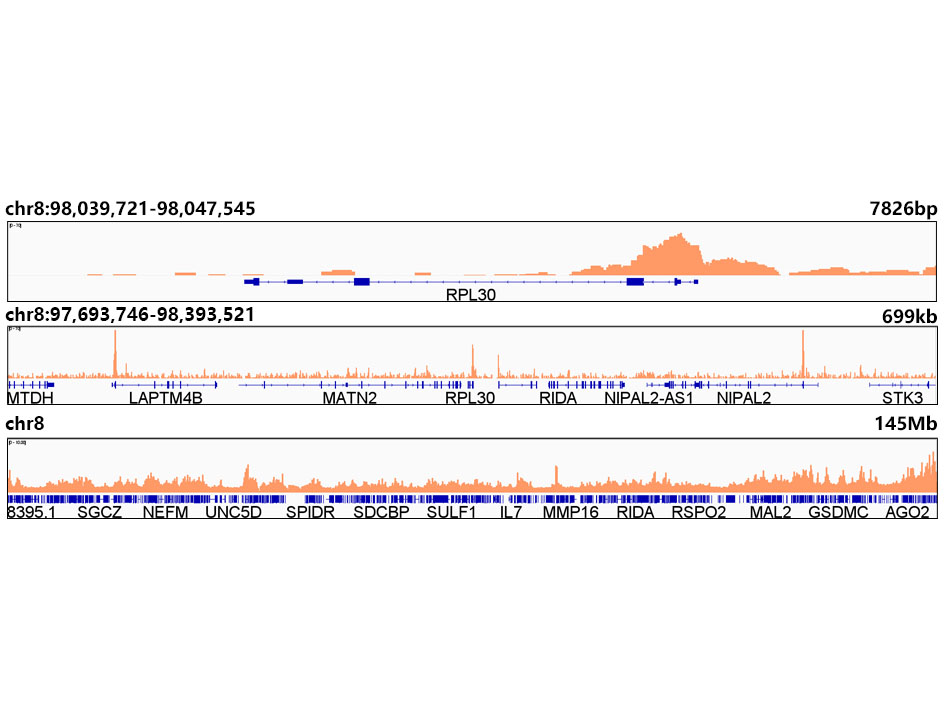
Chromatin immunoprecipitations were performed with cross-linked chromatin from 293T cells and Acetyl-Histone H3-K18 Rabbit mAb. The ChIP sequencing results indicate the enrichment pattern of Acetyl-Histone H3-K18 in selected genomic region and representative gene loci (RPL30), as shown in figure.CUT&Tag
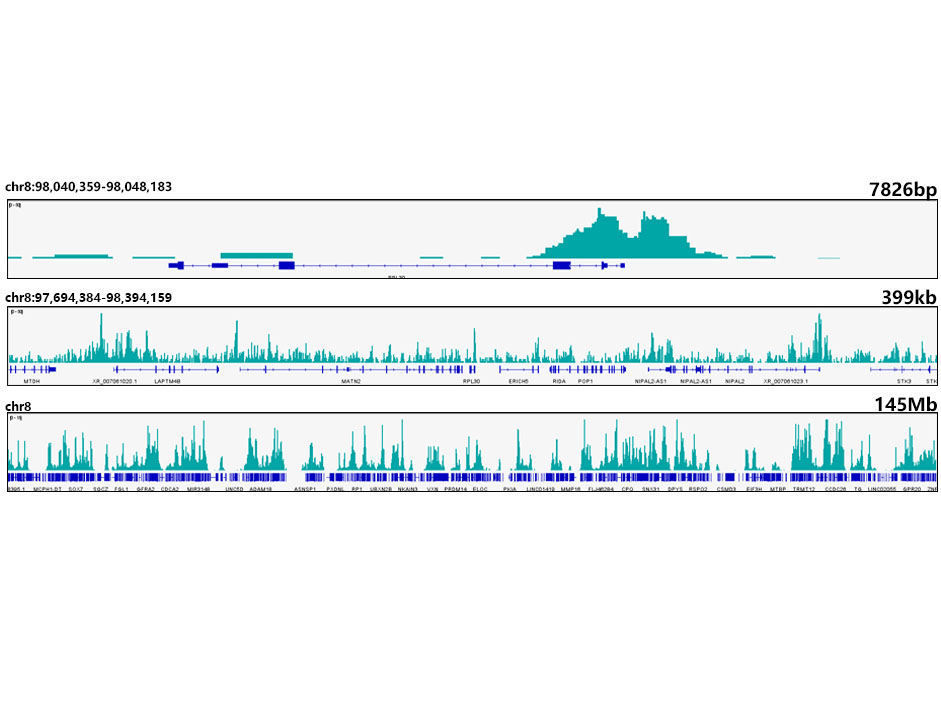
CUT&Tag was performed using the CUT&Tag Assay Kit (pAG-Tn5) for Illumina from 10⁵ K562 cells with 1 μg Acetyl-Histone H3-K18 Rabbit mAb, along with a Goat Anti-Rabbit IgG(H+L). The CUT&Tag results indicate the enrichment pattern of H3K18me1 in representative gene loci (RPL30), as shown in figure.| Product Name | Acetyl-Histone H3-K18 Rabbit mAb |
|---|---|
| Antibody Type | Primary Antibodies |
| Immunogen | Synthetic peptide. This information is considered to be commercially sensitive. |
| Clonality | Monoclonal |
|---|---|
| Isotype | IgG |
| Host Species | Rabbit |
| Tested Applications | ChIPDBIHCWBCUT&Tag-seq |
| WB:1:500-1:1000 DB:1:10000-1:100000 IHC:1:50-1:200 ChIP:5μg antibody for 5μg-10μg of Chromatin CUT&Tag:10⁵ cells /1 μg |
|
| Species Reactivity | HumanMouseOtherRat |
| Concentration | 1mg/ml |
| Purification | Affinity purified |
| Gene Symbol | H3-4 |
|---|---|
| Gene Synonyms | H3t H3.4 H3/g H3FT H3C16 HIST3H3 |
| Gene Full Name | H3.4 histone, cluster member |
| Gene Summary | Histones are basic nuclear proteins that are responsible for the nucleosome structure of the chromosomal fiber in eukaryotes. Nucleosomes consist of approximately 146 bp of DNA wrapped around a histone octamer composed of pairs of each of the four core histones (H2A, H2B, H3, and H4). The chromatin fiber is further compacted through the interaction of a linker histone, H1, with the DNA between the nucleosomes to form higher order chromatin structures. This gene is intronless and encodes a replication-dependent histone that is a member of the histone H3 family. Transcripts from this gene lack polyA tails; instead, they contain a palindromic termination element. This gene is located separately from the other H3 genes that are in the histone gene cluster on chromosome 6p22-p21.3. [provided by RefSeq, Aug 2015] |
| Molecular Weight(MW) | 15 kDa(Observed band size: 17 kDa) |
| Cellular Localization | Chromosome, Nucleus. |
| SwissProt ID | P68431 |
|---|
WB
Western blot analysis of various lysates using Acetyl-Histone H3-K18 Rabbit mAb at 1:1000 dilution. HeLa cells and NIH/3T3 cells and C6 cells were treated with TSA (1 uM) at 37℃ for 18 hours. Secondary antibody: HRP-conjugated Goat anti-Rabbit IgG (H+L) (AS014) at 1:10000 dilution. Lysates/proteins: 25μg per lane. Blocking buffer: 3% nonfat dry milk in TBST. Detection: ECL Basic Kit. Exposure time: 180s.
DB
Dot-blot analysis of all sorts of peptides using Acetyl-Histone H3-K18 Rabbit mAb at 1:100000 dilution.
IHC
Immunohistochemistry analysis of paraffin-embedded Human cervix cancer tissue using Acetyl-Histone H3-K18 Rabbit mAb at a dilution of 1:200 (40x lens). High pressure antigen retrieval performed with 0.01M Citrate buffer (pH 6.0) prior to IHC staining.
IHC
Immunohistochemistry analysis of paraffin-embedded Mouse kidney tissue using Acetyl-Histone H3-K18 Rabbit mAb at a dilution of 1:200 (40x lens). High pressure antigen retrieval performed with 0.01M Citrate buffer (pH 6.0) prior to IHC staining.
IHC
Immunohistochemistry analysis of paraffin-embedded Rat brain tissue using Acetyl-Histone H3-K18 Rabbit mAb at a dilution of 1:200 (40x lens). High pressure antigen retrieval performed with 0.01M Citrate buffer (pH 6.0) prior to IHC staining.
CHIP
Chromatin immunoprecipitation analysis of extracts of HeLa cells, using Acetyl-Histone H3-K18 Rabbit mAb and rabbit IgG.The amount of immunoprecipitated DNA was checked by quantitative PCR. Histogram was constructed by the ratios of the immunoprecipitated DNA to the input.
CHIP
Chromatin immunoprecipitations were performed with cross-linked chromatin from 293T cells and Acetyl-Histone H3-K18 Rabbit mAb. The ChIP sequencing results indicate the enrichment pattern of Acetyl-Histone H3-K18 in selected genomic region and representative gene loci (RPL30), as shown in figure.
CUT&Tag
CUT&Tag was performed using the CUT&Tag Assay Kit (pAG-Tn5) for Illumina from 10⁵ K562 cells with 1 μg Acetyl-Histone H3-K18 Rabbit mAb, along with a Goat Anti-Rabbit IgG(H+L). The CUT&Tag results indicate the enrichment pattern of H3K18me1 in representative gene loci (RPL30), as shown in figure.| Application Notes | WB:1:500-1:1000 DB:1:10000-1:100000 IHC:1:50-1:200 ChIP:5μg antibody for 5μg-10μg of Chromatin CUT&Tag:10⁵ cells /1 μg |
|---|
| Form | Liquid |
|---|---|
| Storage Instructions | Shipped at 4°C. Store at +4°C short term (1-2 weeks). Store at -20°C long term. Avoid freeze / thaw cycle. |
| Storage Buffer | Purified antibody in PBS with 0.05% sodium azide. |


