Application
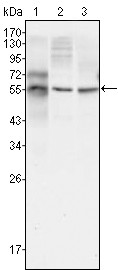
Figure 1: Western blot analysis using TUBB3 mouse mAb against HepG2 (1), A549 (2) and Hela (3) cell lysate.Application
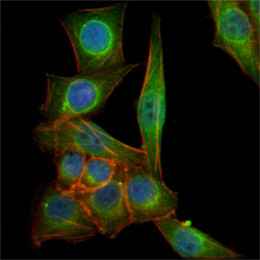
Figure 2: Immunofluorescence analysis of PANC-1 cells using TUBB3 mouse mAb (green). Blue: DRAQ5 fluorescent DNA dye. Red: Actin filaments have been labeled with Alexa Fluor-555 phalloidin.Application
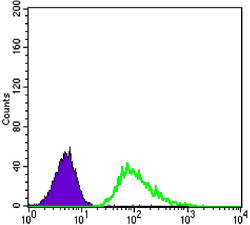
Figure 3: Flow cytometric analysis of A549 cells using anti-TUBB3 mAb (green) and negative control (purple).| Product Name | TUBB3 Antibody |
|---|---|
| Antibody Type | Primary Antibodies |
| Antigen Alias | tubulin, beta 3; MC1R; TUBB4 |
| Clonality | Monoclonal |
|---|---|
| Isotype | IgG1 |
| Clone Number | 2000000000 |
| Host Species | Mouse |
| Tested Applications | WBIFFC |
| WB:1:500 - 2000. IF |
|
| Species Reactivity | Human |
| Concentration | 1mg/ml |
| Gene Synonyms | TUBB4 |
|---|---|
| Alternative Names | tubulin beta 3 MC1R TUBB4 |
| Molecular Weight(MW) | 50433 Da |
| Function | Tubulin is the major constituent of microtubules. It binds two moles of GTP, one at an exchangeable site on the beta chain and one at a non-exchangeable site on the alpha chain. TUBB3 plays a critical role in proper axon guidance and mantainance |
| Tissue Specificity | Expression is primarily restricted to central and peripheral nervous system. Greatly increased expression in most cancerous tissues |
| Cellular Localization | Cytoplasm, cytoskeleton. |
| Entrez Gene | 10381 |
|---|---|
| Nucleotide Accession | NP_006077.2 |
Application
Figure 1: Western blot analysis using TUBB3 mouse mAb against HepG2 (1), A549 (2) and Hela (3) cell lysate.
Application
Figure 2: Immunofluorescence analysis of PANC-1 cells using TUBB3 mouse mAb (green). Blue: DRAQ5 fluorescent DNA dye. Red: Actin filaments have been labeled with Alexa Fluor-555 phalloidin.
Application
Figure 3: Flow cytometric analysis of A549 cells using anti-TUBB3 mAb (green) and negative control (purple).| Application Notes | WB:1:500 - 2000. IF |
|---|
| Form | Liquid |
|---|---|
| Storage Instructions | For short-term storage, store at 4° C. For long-term storage, aliquot and store at -20ºC or below. Avoid multiple freeze-thaw cycles. |
| Storage Buffer | Purified recombinant fragment of human TUBB3 expressed in E. Coli. |


 Data sheet for OM223906