Application
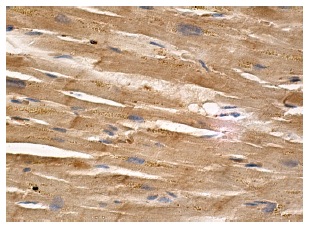
Immunoperoxidase staining of formalin fixed, paraffin-embedded human heart muscle tissue showing cytoplasmic staining of myocytes.Application
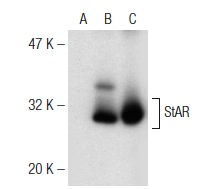
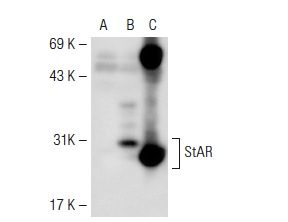
Western blot analysis of StAR expression in non-transfected: (A) and human StAR transfected: (B) 293 whole cell lysates and rat adrenal gland tissue extract (C).Application
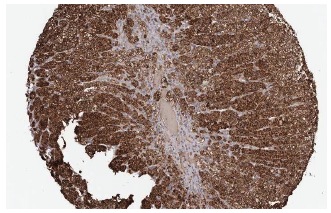
Immunoperoxidase staining of formalin fixed, paraffin-embedded human adrenal gland tissue showing cytoplasmic staining of cortical cells at low magnification. Kindly provided by The Swedish Human Protein Atlas (HPA) program.Application
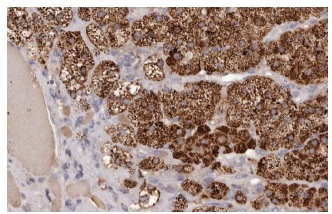
Immunoperoxidase staining of formalin fixed, paraffin-embedded human adrenal gland tissue showing cytoplasmic staining of cortical cells at high magnification. Kindly provided by The Swedish Human Protein Atlas (HPA) program.Application
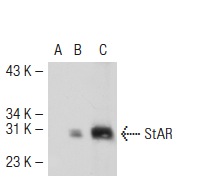
Western blot analysis of StAR expression in non-transfected: (A) and human StAR transfected: (B) 293T whole cell lysates and rat adrenal gland tissue extract (C).Application
Western blot analysis of StAR expression in non-transfected: (A) and mouse StAR transfected: (B) 293T whole cell lysates and mouse adrenal tissue extract (C).Application
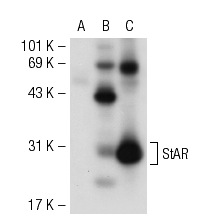
Western blot analysis of StAR expression in non-transfected: (A) and mouse StAR transfected: (B) 293T whole cell lysates and rat adrenal gland tissue extract (C).Application
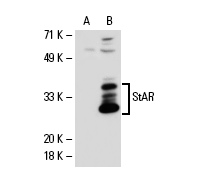
Western blot analysis of StAR expression in non-transfected: (A) and human StAR transfected: (B) 293 whole cell lysates.WB
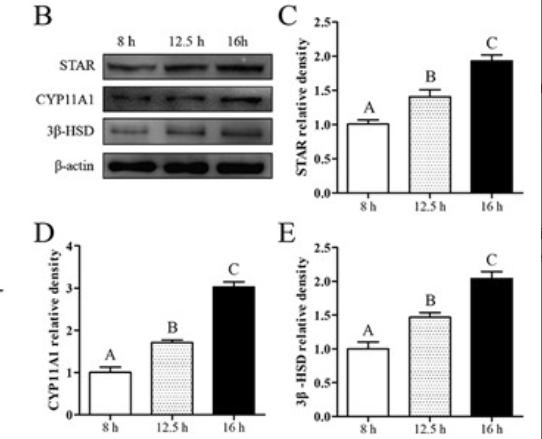
(B–E) Western blot analysis and relative densitometric analysis of STAR, CYP11A1, and 3β-HSD protein levels. β-actin protein levels was used to determine and normalize the densitometric values of the band (n = 6).WB
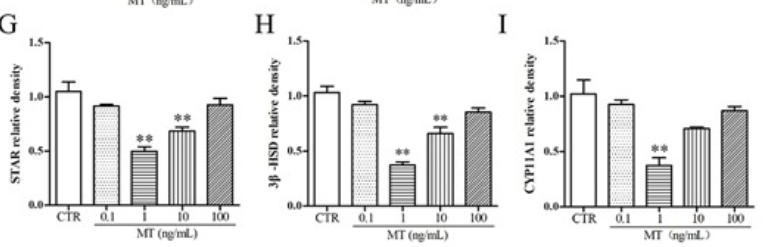
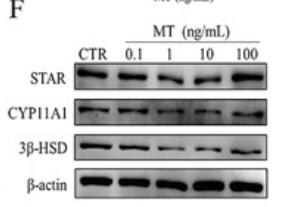
(F–I) Western blot analysis and relative densitometric analysis of STAR, CYP11A1, and 3β-HSD protein levels (n = 3).WB
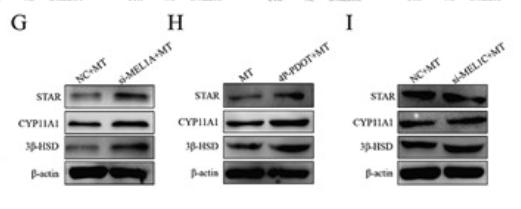
(G–I) Western blot analysis of STAR, CYP11A1, and 3β-HSD protein levels (n = 3).WB
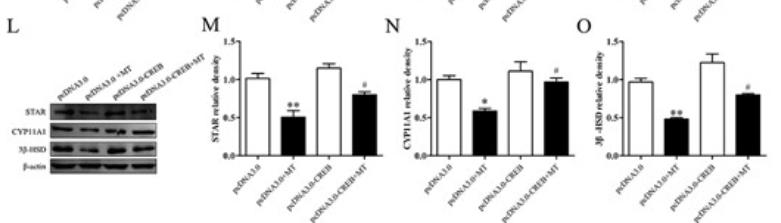
(L–O) Western blot analysis and relative densitometric analysis of STAR, CYP11A1, and 3β-HSD protein levels. β-actin was used to determine and normalize the densitometric values of the bands (n = 3).WB
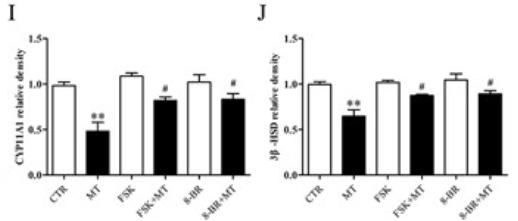
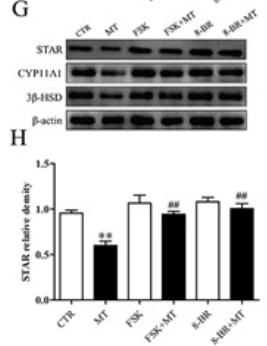
(G–J) Western blot analysis and relative densitometric analysis of STAR, CYP11A1, and 3β-HSD protein levels. β-actin was used to determine and normalize the densitometric values of the bands (n = 3).WB
(G–J) Western blot analysis and relative densitometric analysis of STAR, CYP11A1, and 3β-HSD protein levels. β-actin was used to determine and normalize the densitometric values of the bands (n = 3).WB
(F–I) Western blot analysis and relative densitometric analysis of STAR, CYP11A1, and 3β-HSD protein levels (n = 3).| Product Name | StAR Antibody (FL-285) |
|---|---|
| Antibody Type | Primary Antibodies |
| Conjugation | Agarose |
| Modification | Acetylated |
| Modification Notes | Steroidogenic acute regulatory (StAR) protein appears to mediate the rapid increase in pregnenolone synthesis stimulated by tropic hormones (1). StAR increases pregnenolone synthesis more than 4-fold and a major StAR transcript of 1.6 kb is found in ovary and testis (1). During ongoing growth and differentiation of the follicle of the ovary, the immunoreactivity of StAR tends to shift from the granulosa cells of early antral follicles to the theca cell layers in the adult (2-4). The first and rate-limiting step of steroidogenesis is the transfer of cholesterol from the outer mitochondrial membrane to the inner membrane where it is converted to pregnenolone by cytochrome P450 side-chain cleavage (3). This reaction is modulated in the gonads and adrenals by StAR, however, the mechanism used by StAR is not understood (3). This protein was isolated from a human adrenal cortex library and nonsense mutations in the StAR gene can cause lipoid congenital adrenal hyperplasia (2). The gene which encodes StAR maps to human chromosome 8p11.2 (1,5). |
| Clonality | Polyclonal |
|---|---|
| Isotype | IgG |
| Host Species | Rabbit |
| Tested Applications | ELISAIFIHCIPWB |
| WB:1:100~1:400 IP:1:20~1:100 IF:1:20~1:100 IHC:1:10~1:50 |
|
| Species Reactivity | HumanMouseRat |
| Concentration | 1mg/ml |
| Purification | Affinity purified |
| Alternative Names | epitope corresponding to amino acids 1-285 representing full length StAR of human origin |
|---|---|
| Tissue Specificity | epitope corresponding to amino acids 1-285 representing full length StAR of human origin |
| Entrez Gene | 6770 |
|---|
Application
Immunoperoxidase staining of formalin fixed, paraffin-embedded human heart muscle tissue showing cytoplasmic staining of myocytes.
Application
Western blot analysis of StAR expression in non-transfected: (A) and human StAR transfected: (B) 293 whole cell lysates and rat adrenal gland tissue extract (C).
Application
Immunoperoxidase staining of formalin fixed, paraffin-embedded human adrenal gland tissue showing cytoplasmic staining of cortical cells at low magnification. Kindly provided by The Swedish Human Protein Atlas (HPA) program.
Application
Immunoperoxidase staining of formalin fixed, paraffin-embedded human adrenal gland tissue showing cytoplasmic staining of cortical cells at high magnification. Kindly provided by The Swedish Human Protein Atlas (HPA) program.
Application
Western blot analysis of StAR expression in non-transfected: (A) and human StAR transfected: (B) 293T whole cell lysates and rat adrenal gland tissue extract (C).
Application
Western blot analysis of StAR expression in non-transfected: (A) and mouse StAR transfected: (B) 293T whole cell lysates and mouse adrenal tissue extract (C).
Application
Western blot analysis of StAR expression in non-transfected: (A) and mouse StAR transfected: (B) 293T whole cell lysates and rat adrenal gland tissue extract (C).
Application
Western blot analysis of StAR expression in non-transfected: (A) and human StAR transfected: (B) 293 whole cell lysates.
WB
(B–E) Western blot analysis and relative densitometric analysis of STAR, CYP11A1, and 3β-HSD protein levels. β-actin protein levels was used to determine and normalize the densitometric values of the band (n = 6).
WB
(F–I) Western blot analysis and relative densitometric analysis of STAR, CYP11A1, and 3β-HSD protein levels (n = 3).
WB
(G–I) Western blot analysis of STAR, CYP11A1, and 3β-HSD protein levels (n = 3).
WB
(L–O) Western blot analysis and relative densitometric analysis of STAR, CYP11A1, and 3β-HSD protein levels. β-actin was used to determine and normalize the densitometric values of the bands (n = 3).
WB
(G–J) Western blot analysis and relative densitometric analysis of STAR, CYP11A1, and 3β-HSD protein levels. β-actin was used to determine and normalize the densitometric values of the bands (n = 3).
WB
(G–J) Western blot analysis and relative densitometric analysis of STAR, CYP11A1, and 3β-HSD protein levels. β-actin was used to determine and normalize the densitometric values of the bands (n = 3).
WB
(F–I) Western blot analysis and relative densitometric analysis of STAR, CYP11A1, and 3β-HSD protein levels (n = 3).| Application Notes | WB:1:100~1:400 IP:1:20~1:100 IF:1:20~1:100 IHC:1:10~1:50 |
|---|
| Form | Liquid |
|---|---|
| Storage Instructions | For short-term storage, store at 4° C. For long-term storage, aliquot and store at -20ºC or below. Avoid multiple freeze-thaw cycles. |
| Storage Buffer | phosphate buffered saline , pH 7.4, 150mM NaCl, 0.02% sodium azide and 50% glycerol. |


