

Application
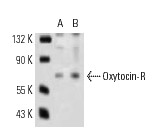
Western blot analysis of Oxytocin-R expression in HeLa (A) and MCF7 (B) whole cell lysates.WB
(B) Western blotting bands (a) and the summary graph (b) (n = 6). (C) Protein bands showing coimmunoprecipitation of OTR with HCN3. The noncontiguous gel lanes are reassembled from two sections of the same protein membrane after removal of irrelevant bands. Note: IgG and total lysate (TL): negative and positive controls, respectively; IgG-HC, IgG heavy chain. **p< .01 versus control by ANOVA. PreviousWB
Effects of PD on the Expressions of Cox-2 and its Influences on OT-Modulated Molecular Association Between OTR and HCN3 in the SON. (A) Western blotting bands (a) and the summary graphs (b) displaying PD effects on the expression of Cox-2 (n = 7). (B) Representative protein bands showing coimmunoprecipitation of OTR with HCN3 in the SON of brain slices (a) and the summary graph (b, n = 4), respectively. The noncontiguous gel lanes are reassembled from two sections of the same protein membrane after removal of irrelevant bands. #p < .05 compared with OT by ANOVA. *p < .05, **p < .01 versus control by ANOVA. PreviousWB
(B–D). Western blot bands (a) and the bar-graphs showing the effects of IPD and CPD on the expression of OTR (B), Gβ subunit (C) and Gαq subunit (D) respectively. PreviousWB
(B). Protein bands showing co-immunoprecipitation of F-actin with cPKA. IgG (not shown here) and total lysate (TL) were used as negative and positive controls, respectively; IgG-HC, IgG heavy chain.WB
(B–D) Representative Western blot bands (a) and the summary graphs (b) showing the expression of OTR ((B) n = 7), Gαq subunit ((C) n = 6) and Gβ subunit ((D) n = 7) under different experimental conditions.| Product Name | Oxytocin-R Antibody (H-60) |
|---|---|
| Antibody Type | Primary Antibodies |
| Modification Notes | Oxytocin (OXT) is a pituitary hormone that has long been associated with uterine contraction during parturition and with milk ejection during nursing. Studies have suggested that Oxytocin is also a neurotransmitter with reproductively important effects. The receptor for Oxytocin (Oxytocin-R) is an integral membrane protein that is a member of the G protein-coupled receptor family. Uterine and cervical Oxytocin receptors are significantly up-regulated during gestation, via both endocrine and mechanical signals, suggesting that Oxytocin receptors may be involved in parturition. Inhibition of Oxytocin receptor synthesis by IFN-t and IFN-a may be a mechanism for Oxytocin receptor suppression during early pregnancy. |
| Clonality | Polyclonal |
|---|---|
| Isotype | IgG |
| Host Species | Rabbit |
| Tested Applications | ELISAIFIPWB |
| recommended for detection of Oxytocin-R of mouse, rat and human origin by WB, IP, IF and ELISA: |
|
| Species Reactivity | HumanMouseRat |
| Concentration | 1mg/ml |
| Purification | Affinity purified |
| Alternative Names | epitope corresponding to amino acids 330-389 mapping at the C-terminus of Oxytocin-R of human origin |
|---|---|
| Tissue Specificity | epitope corresponding to amino acids 330-389 mapping at the C-terminus of Oxytocin-R of human origin |
| Entrez Gene | 5021 |
|---|
Application
Western blot analysis of Oxytocin-R expression in HeLa (A) and MCF7 (B) whole cell lysates.
WB
(B) Western blotting bands (a) and the summary graph (b) (n = 6). (C) Protein bands showing coimmunoprecipitation of OTR with HCN3. The noncontiguous gel lanes are reassembled from two sections of the same protein membrane after removal of irrelevant bands. Note: IgG and total lysate (TL): negative and positive controls, respectively; IgG-HC, IgG heavy chain. **p< .01 versus control by ANOVA. Previous
WB
Effects of PD on the Expressions of Cox-2 and its Influences on OT-Modulated Molecular Association Between OTR and HCN3 in the SON. (A) Western blotting bands (a) and the summary graphs (b) displaying PD effects on the expression of Cox-2 (n = 7). (B) Representative protein bands showing coimmunoprecipitation of OTR with HCN3 in the SON of brain slices (a) and the summary graph (b, n = 4), respectively. The noncontiguous gel lanes are reassembled from two sections of the same protein membrane after removal of irrelevant bands. #p < .05 compared with OT by ANOVA. *p < .05, **p < .01 versus control by ANOVA. Previous
WB
(B–D). Western blot bands (a) and the bar-graphs showing the effects of IPD and CPD on the expression of OTR (B), Gβ subunit (C) and Gαq subunit (D) respectively. Previous
WB
(B). Protein bands showing co-immunoprecipitation of F-actin with cPKA. IgG (not shown here) and total lysate (TL) were used as negative and positive controls, respectively; IgG-HC, IgG heavy chain.
WB
(B–D) Representative Western blot bands (a) and the summary graphs (b) showing the expression of OTR ((B) n = 7), Gαq subunit ((C) n = 6) and Gβ subunit ((D) n = 7) under different experimental conditions.| Application Notes | recommended for detection of Oxytocin-R of mouse, rat and human origin by WB, IP, IF and ELISA: |
|---|
| Form | Liquid |
|---|---|
| Storage Instructions | For short-term storage, store at 4° C. For long-term storage, aliquot and store at -20ºC or below. Avoid multiple freeze-thaw cycles. |
| Storage Buffer | phosphate buffered saline , pH 7.4, 150mM NaCl, 0.02% sodium azide and 50% glycerol. |


