WB
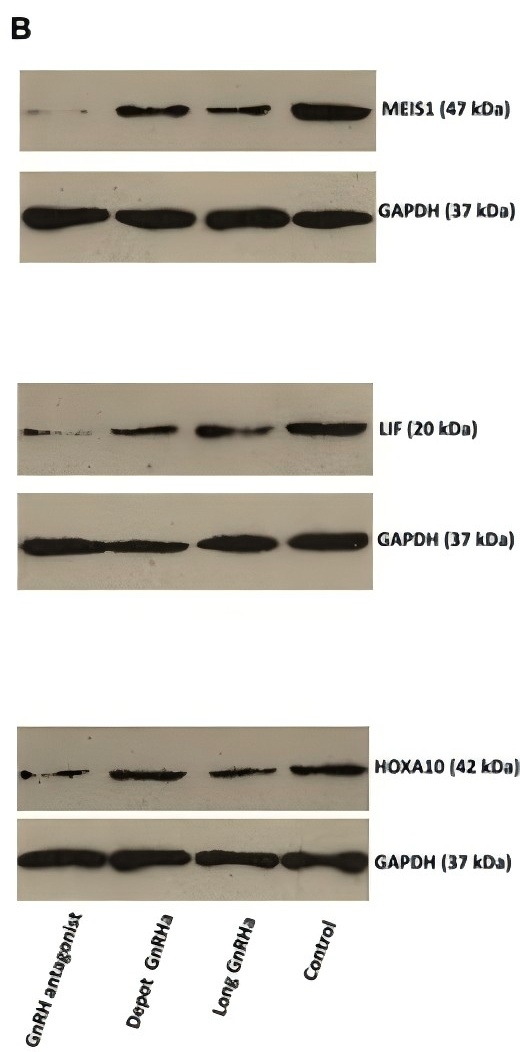
(B) Western blot analysis of MEIS1, LIF and HOXA10 protein levels in the endometrium from women undergoing three different COS protocols, and in an unstimulated control group. The marker protein levels were calculated as a ratio of their densitometric value to that of the GAPDH reference gene, and are represented in the right panel. N = 3 for western blot analysis. The densitometric values for the GAPDH reference protein were comparable for all samples. For comparison between treatment groups, protein expression level ratios were defined as 1 in the control groups. #The difference in mRNA and protein expression between the COS groups and the unstimulated control group was statistically significant for HOXA10 and MEIS1 genes (P < 0.05, one-way ANOVA with Bonferroni post hoc test).| Product Name | Meis1/2 Antibody (H-80) |
|---|---|
| Antibody Type | Primary Antibodies |
| Modification Notes | Hox, Pbx and Meis families of transcription factors form heteromeric complexes and bind DNA through specific homeobox domains. Hox proteins are involved in regulating tissue patterning during development, and are also expressed in lineage- and stage-specific patterns during adult hematopoietic differentiation and in leukemias. The Hox proteins, which include paralog groups 1-10, have a low intrinsic binding affinity for DNA and are instead associated into cooperative DNA binding complexes with Pbx or the Pbx- related Meis proteins, which result in an enhanced Hox-DNA binding affinity and an increased selectivity for the binding site. Both Meis1 and Meis2 (also known as Meis-related gene 1 or Mrg1) are members of the TALE (“three amino acid loop extension”) family of homeodomain-containing proteins. In addition to binding with Hox proteins, Meis1 also forms heterodimers with the ubiquitously expressed Pbx proteins, including Pbx1, Pbx2 and Pbx3, and these complexes contain distinct DNA-binding specificities. Like Hox and Pbx proteins, Meis1 is implicated in oncogenesis, as it is overexpressed as a result of adjacent retroviral insertion in BHX-2 myeloid leukemias. Two Meis-related proteins, Meis2 and Meis3 (also designated Mrg1 and Mrg2, respectively), possess largely similar sequence identity with Meis1 and are expressed in normal tissues and myeloid leukemias. In the pancreas, Meis2 preferentially associates with Pbx1, and together they associate with the pancreas-specific homeodomain factor, Pdx1, to repress Pdx1-induced transcriptional activation. |
| Clonality | Polyclonal |
|---|---|
| Isotype | IgG |
| Host Species | Rabbit |
| Tested Applications | ChIPELISAGSIFIPWB |
| recommended for detection of Meis1 and Meis2 of mouse, rat and human origin by WB, IP, IF and ELISA also reactive with additional species, including equine, canine, bovine, porcine and avian: |
|
| Species Reactivity | HumanMouseRat |
| Concentration | 1mg/ml |
| Purification | Affinity purified |
| Alternative Names | epitope corresponding to amino acids 1-80 mapping at the N-terminus of Meis1 of human origin |
|---|---|
| Tissue Specificity | epitope corresponding to amino acids 1-80 mapping at the N-terminus of Meis1 of human origin |
| Entrez Gene | 4211 |
|---|
WB
(B) Western blot analysis of MEIS1, LIF and HOXA10 protein levels in the endometrium from women undergoing three different COS protocols, and in an unstimulated control group. The marker protein levels were calculated as a ratio of their densitometric value to that of the GAPDH reference gene, and are represented in the right panel. N = 3 for western blot analysis. The densitometric values for the GAPDH reference protein were comparable for all samples. For comparison between treatment groups, protein expression level ratios were defined as 1 in the control groups. #The difference in mRNA and protein expression between the COS groups and the unstimulated control group was statistically significant for HOXA10 and MEIS1 genes (P < 0.05, one-way ANOVA with Bonferroni post hoc test).| Application Notes | recommended for detection of Meis1 and Meis2 of mouse, rat and human origin by WB, IP, IF and ELISA also reactive with additional species, including equine, canine, bovine, porcine and avian: |
|---|
| Form | Liquid |
|---|---|
| Storage Instructions | For short-term storage, store at 4° C. For long-term storage, aliquot and store at -20ºC or below. Avoid multiple freeze-thaw cycles. |
| Storage Buffer | phosphate buffered saline , pH 7.4, 150mM NaCl, 0.02% sodium azide and 50% glycerol. |


