Application
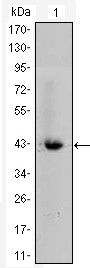
Figure 1: Western blot analysis using CTNNB1 mAb against CTNNB1-hIgGFc transfected HEK293 cell lysate.Application
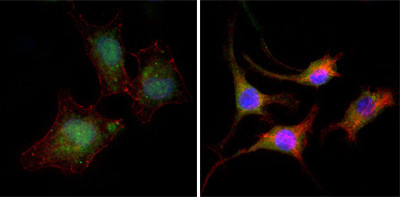
Figure 2:Immunofluorescence analysis of A549 (left) and SK-BR-3 (right) cells using anti-CTNNB1 mAb (green). Red: Actin filaments have been labeled with DY-554 phalloidin. Blue: DRAQ5 fluorescent DNA dye.Application
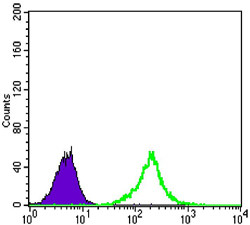
Figure 3: Flow cytometric analysis of A549 cells using anti-CTNNB1 mAb (green) and negative control (purple).| Product Name | CTNNB1 Antibody |
|---|---|
| Antibody Type | Primary Antibodies |
| Antigen Alias | CTNNB; FLJ25606; FLJ37923; DKFZp686D02253; CTNNB1 |
| Clonality | Monoclonal |
|---|---|
| Isotype | IgG1 |
| Clone Number | 4D5 |
| Host Species | Mouse |
| Tested Applications | WBIFFC |
| WB:1:500 - 2000. IF |
|
| Species Reactivity | Human |
| Concentration | 1mg/ml |
| Gene Synonyms | CTNNB |
|---|---|
| Alternative Names | CTNNB FLJ25606 FLJ37923 DKFZp686D02253 CTNNB1 |
| Molecular Weight(MW) | 85497 Da |
| Function | Key downstream component of the canonical Wnt signaling pathway. In the absence of Wnt, forms a complex with AXIN1, AXIN2, APC, CSNK1A1 and GSK3B that promotes phosphorylation on N-terminal Ser and Thr residues and ubiquitination of CTNNB1 via BTRC and its subsequent degradation by the proteasome. In the presence of Wnt ligand, CTNNB1 is not ubiquitinated and accumulates in the nucleus, where it acts as a coactivator for transcription factors of the TCF/LEF family, leading to activate Wnt responsive genes Involved in the regulation of cell adhesion. Acts as a negative regulator of centrosome cohesion. Involved in the CDK2/PTPN6/CTNNB1/CEACAM1 pathway of insulin internalization Blocks anoikis of malignant kidney and intestinal epithelial cells and promotes their anchorage-independent growth by down-regulating DAPK2 |
| Tissue Specificity | Expressed in several hair follicle cell types: basal and peripheral matrix cells, and cells of the outer and inner root sheaths. Expressed in colon. Present in cortical neurons (at protein level) |
| Cellular Localization | Cytoplasm. Nucleus. Cytoplasm, cytoskeleton. Cell junction, adherens junction. Cell junction. Cell membrane Cytoplasm, cytoskeleton, centrosome. Cytoplasm, cytoskeleton, spindle pole. Note=Cytoplasmic when it is unstabilized (high level of phosphorylation) or bound to CDH1. Translocates to the nucleus when it is stabilized (low level of phosphorylation). Interaction with GLIS2 and MUC1 promotes nuclear translocation. Interaction with EMD inhibits nuclear localization. The majority of beta- catenin is localized to the cell membrane. In interphase, colocalizes with CROCC between CEP250 puncta at the proximal end of centrioles, and this localization is dependent on CROCC and CEP250. In mitosis, when NEK2 activity increases, it localizes to centrosomes at spindle poles independent of CROCC. Co-localizes with CDK5 in the cell-cell contacts and plasma membrane of undifferentiated and differentiated neuroblastoma cells |
| Entrez Gene | 1499 |
|---|---|
| Nucleotide Accession | NP_001895.1 |
Application
Figure 1: Western blot analysis using CTNNB1 mAb against CTNNB1-hIgGFc transfected HEK293 cell lysate.
Application
Figure 2:Immunofluorescence analysis of A549 (left) and SK-BR-3 (right) cells using anti-CTNNB1 mAb (green). Red: Actin filaments have been labeled with DY-554 phalloidin. Blue: DRAQ5 fluorescent DNA dye.
Application
Figure 3: Flow cytometric analysis of A549 cells using anti-CTNNB1 mAb (green) and negative control (purple).| Application Notes | WB:1:500 - 2000. IF |
|---|
| Form | Liquid |
|---|---|
| Storage Instructions | For short-term storage, store at 4° C. For long-term storage, aliquot and store at -20ºC or below. Avoid multiple freeze-thaw cycles. |
| Storage Buffer | Purified recombinant fragment of human CTNNB1 expressed in E. Coli. |


