Application
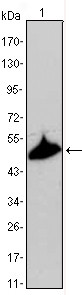
Figure 1: Western blot analysis using anti-KRT15 mAb against A431 cell lysate.Application
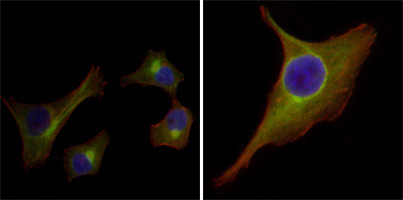
Figure 2:Immunofluorescence analysis of HepG2(left) and PACN-1(right) cells using anti-KRT15 mAb (green). Red: Actin filaments have been labeled with DY-554 phalloidin. Blue: DRAQ5 fluorescent DNA dye.Application
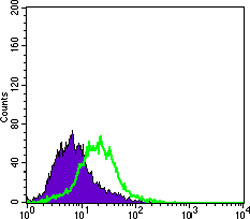
Figure 3: Flow cytometric analysis of PACN-1 cells using anti-KRT15 mAb (green) and negative control (purple).| Product Name | KRT15 Antibody |
|---|---|
| Antibody Type | Primary Antibodies |
| Antigen Alias | K15; CK15; K1CO; KRT1 |
| Clonality | Monoclonal |
|---|---|
| Isotype | IgG2a |
| Clone Number | 60000000 |
| Host Species | Mouse |
| Tested Applications | WBIFFC |
| WB:1:500 - 2000. IF |
|
| Species Reactivity | Human |
| Concentration | 1mg/ml |
| Gene Synonyms | KRTB |
|---|---|
| Alternative Names | K15 CK15 K1CO KRT1 |
| Molecular Weight(MW) | 49212 Da |
| Tissue Specificity | Expressed in a discontinuous manner in the basal cell layer of adult skin epidermis, but continuously in the basal layer of fetal skin epidermis and nail. Also expressed in the outer root sheath above the hair bulb in hair follicle (at protein level). Expressed homogeneously in all cell layers of the esophagus and exocervix, but detected in the basal cell layer only of oral mucosa, skin and in the basal plus the next two layers of the suprabasal epithelium of the palate |
| Entrez Gene | 3866 |
|---|---|
| Nucleotide Accession | NP_002266.2 |
Application
Figure 1: Western blot analysis using anti-KRT15 mAb against A431 cell lysate.
Application
Figure 2:Immunofluorescence analysis of HepG2(left) and PACN-1(right) cells using anti-KRT15 mAb (green). Red: Actin filaments have been labeled with DY-554 phalloidin. Blue: DRAQ5 fluorescent DNA dye.
Application
Figure 3: Flow cytometric analysis of PACN-1 cells using anti-KRT15 mAb (green) and negative control (purple).| Application Notes | WB:1:500 - 2000. IF |
|---|
| Form | Liquid |
|---|---|
| Storage Instructions | For short-term storage, store at 4° C. For long-term storage, aliquot and store at -20ºC or below. Avoid multiple freeze-thaw cycles. |
| Storage Buffer | Purified recombinant fragment of KRT15 expressed in E. Coli. |


