Application
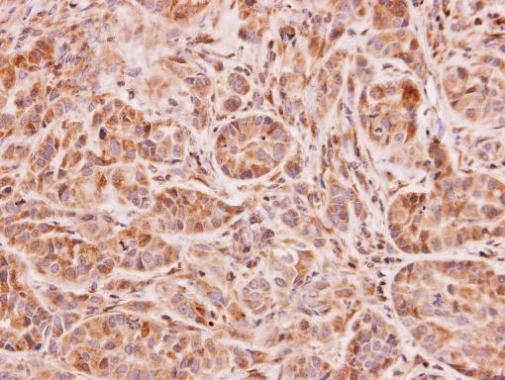
Immunohistochemical analysis of paraffin-embedded A549 xenograft, using NAT2 antibody at 1:100 dilution.Application
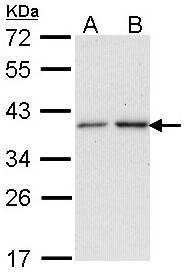
Sample (30 ug of whole cell lysate) A: A431 B: H1299 12% SDS PAGE diluted at 1:1000WB
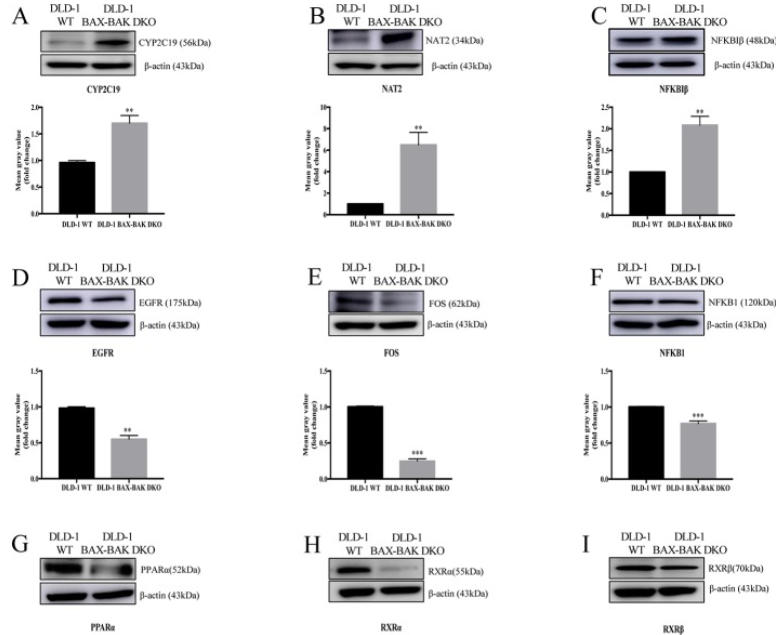
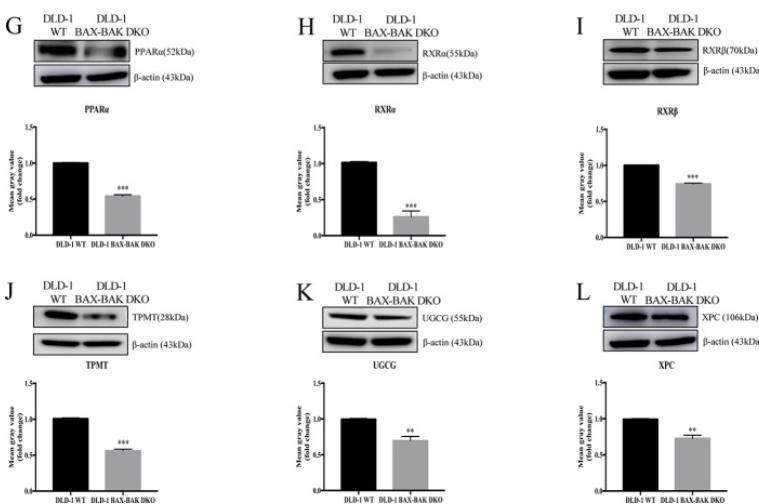
(A–L) Cropped images showed protein expression levels of CYP2C19, NAT2, NFKBIβ, EGFR, FOS, NFKB1, PPARα, RXRα, RXRβ, TPMT, UGCG, and XPC in DLD-1 WT and DLD-1 BAX–BAK DKO cells. Bar charts presented relative changes of mean gray value, which was normalized to that of β-actin.WB
(A–L) Cropped images showed protein expression levels of CYP2C19, NAT2, NFKBIβ, EGFR, FOS, NFKB1, PPARα, RXRα, RXRβ, TPMT, UGCG, and XPC in DLD-1 WT and DLD-1 BAX–BAK DKO cells. Bar charts presented relative changes of mean gray value, which was normalized to that of β-actin.| Product Name | NAT2 antibody |
|---|---|
| Antibody Type | Primary Antibodies |
| Product description | Rabbit Polyclonal antibody to NAT2 (N-acetyltransferase 2 (arylamine N-acetyltransferase))This gene encodes an enzyme that functions to both activate and deactivate arylamine and hydrazine drugs and carcinogens. Polymorphisms in this gene are responsible for the N-acetylation polymorphism in which human populations segregate into rapid, intermediate, and slow acetylator phenotypes. Polymorphisms in this gene are also associated with higher incidences of cancer and drug toxicity. A second arylamine N-acetyltransferase gene (NAT1) is located near this gene (NAT2). [provided by RefSeq] |
| Immunogen | Recombinant protein encompassing a sequence within the center region of human NAT2. The exact sequence is proprietary. |
| Modification | Acetylated |
| Clonality | Polyclonal |
|---|---|
| Isotype | IgG |
| Host Species | Rabbit |
| Tested Applications | IHC-PWB |
| WB:1:200~1:1000 IHC:1:20~1:100 *Optimal dilutions/concentrations should be determined by the researcher.: |
|
| Species Reactivity | Human |
| Predicted Reactivity | Rhesus MonkeyRhesus Monkey (91%) |
| Concentration | 1mg/ml |
| Purification | Affinity purified |
| Gene Synonyms | AAC2 antibody PNAT antibody NAT2 antibody arylamine N-acetyltransferase 2 antibody NAT-2 antibody N-acetyltransferase type 2 antibody arylamide acetylase 2 antibody N-acetyltransferase 2 (arylamine N-acetyltransferase) antibody |
|---|---|
| Molecular Weight(MW) | 34 kDa (note) (2) |
| Cellular Localization | Cytoplasm |
Application
Immunohistochemical analysis of paraffin-embedded A549 xenograft, using NAT2 antibody at 1:100 dilution.
Application
Sample (30 ug of whole cell lysate) A: A431 B: H1299 12% SDS PAGE diluted at 1:1000
WB
(A–L) Cropped images showed protein expression levels of CYP2C19, NAT2, NFKBIβ, EGFR, FOS, NFKB1, PPARα, RXRα, RXRβ, TPMT, UGCG, and XPC in DLD-1 WT and DLD-1 BAX–BAK DKO cells. Bar charts presented relative changes of mean gray value, which was normalized to that of β-actin.
WB
(A–L) Cropped images showed protein expression levels of CYP2C19, NAT2, NFKBIβ, EGFR, FOS, NFKB1, PPARα, RXRα, RXRβ, TPMT, UGCG, and XPC in DLD-1 WT and DLD-1 BAX–BAK DKO cells. Bar charts presented relative changes of mean gray value, which was normalized to that of β-actin.| Positive Control | 293T , A431 , H1299 , HeLa , HepG2 , Molt-4 , Raji |
|---|---|
| Application Notes | WB:1:200~1:1000 IHC:1:20~1:100 *Optimal dilutions/concentrations should be determined by the researcher.: |
| Form | Liquid |
|---|---|
| Storage Instructions | Keep as concentrated solution. Aliquot and store at -20ºC or below. Avoid multiple freeze-thaw cycles. |
| Storage Buffer | 0.1M Tris, 0.1M Glycine, 20% Glycerol (pH7). 0.01% Thimerosal was added as a preservative. |


