Application
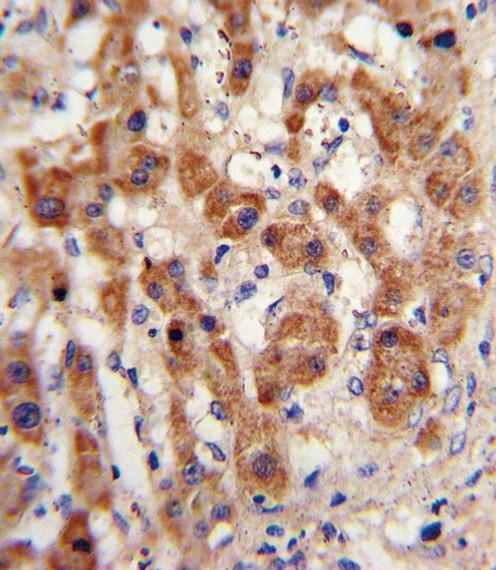
Formalin-fixed and paraffin-embedded human hepatocarcinoma with NAT2 Antibody , which was peroxidase-conjugated to the secondary antibody, followed by DAB staining.Application
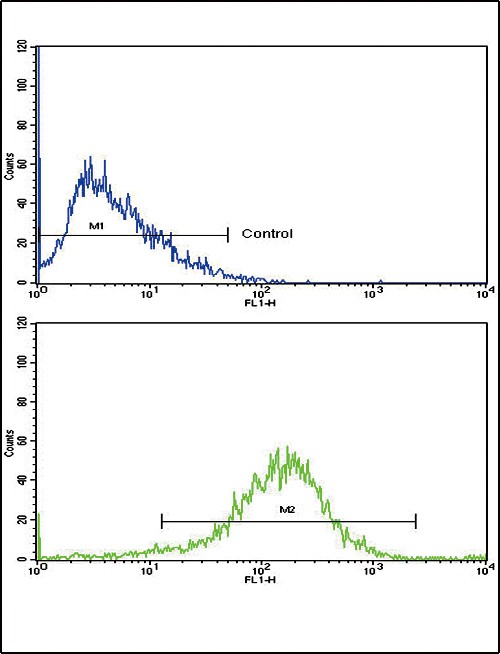
Flow cytometric analysis of HepG2 cells using NAT2 Antibody (bottom histogram) compared to a negative control cell (top histogram). FITC-conjugated goat-anti-rabbit secondary antibodies were used for the analysis.Application
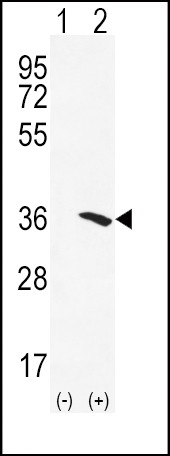
Western blot analysis of NAT2 using rabbit polyclonal NAT2 Antibody using 293 cell lysates (2 ug/lane) either nontransfected (Lane 1) or transiently transfected (Lane 2) with the NAT2 gene.Application
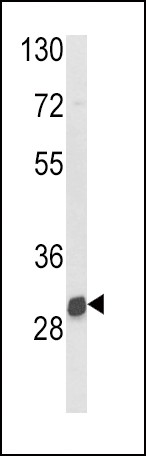
Western blot analysis of NAT2 Antibody in mouse kidney tissue lysates (35ug/lane)WB
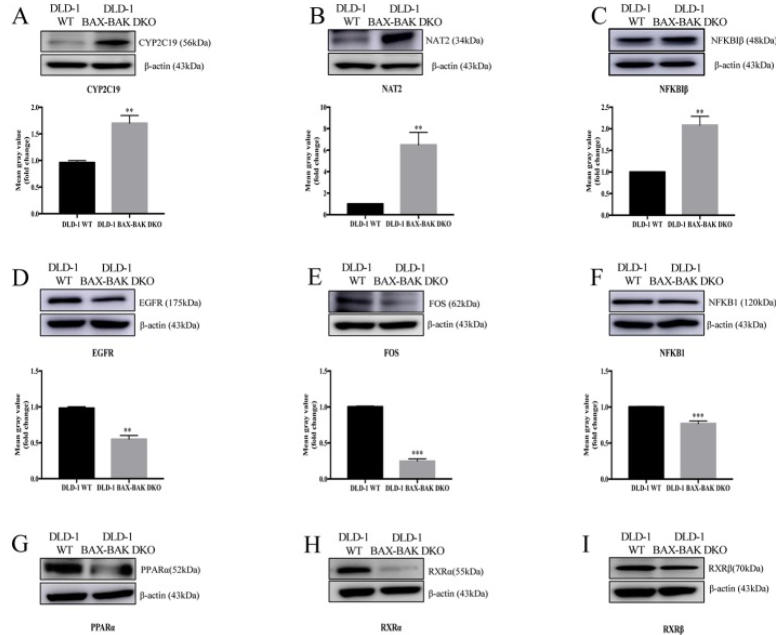
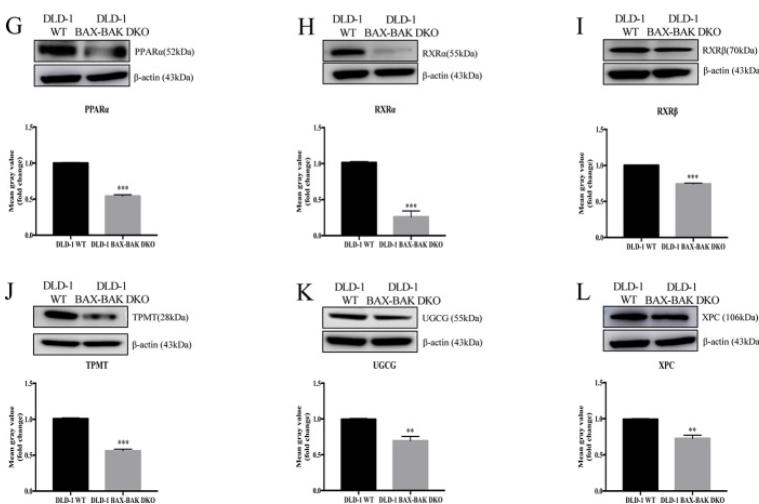
(A–L) Cropped images showed protein expression levels of CYP2C19, NAT2, NFKBIβ, EGFR, FOS, NFKB1, PPARα, RXRα, RXRβ, TPMT, UGCG, and XPC in DLD-1 WT and DLD-1 BAX–BAK DKO cells. Bar charts presented relative changes of mean gray value, which was normalized to that of β-actin.WB
(A–L) Cropped images showed protein expression levels of CYP2C19, NAT2, NFKBIβ, EGFR, FOS, NFKB1, PPARα, RXRα, RXRβ, TPMT, UGCG, and XPC in DLD-1 WT and DLD-1 BAX–BAK DKO cells. Bar charts presented relative changes of mean gray value, which was normalized to that of β-actin.| Product Name | NAT2 Antibody |
|---|---|
| Antibody Type | Primary Antibodies |
| Product description | NAT2 is an enzyme that functions to both activate and deactivate arylamine and hydrazine drugs and carcinogens.1) Kim,S.H., et.al., Pharmacogenomics 10 (11), 1767-1779 (2009) |
| Immunogen | This NAT2 antibody is generated from rabbits immunized with a KLH conjugated synthetic peptide between 226-254 amino acids from the C-terminal region of human NAT2. |
| Clonality | Polyclonal |
|---|---|
| Isotype | Ig |
| Host Species | Rabbit |
| Tested Applications | FACSIHC-PWB |
| For WB starting dilution is: 1:1000 For IHC-P starting dilution is: 1:10~50 For FACS starting dilution is: 1:10~50 | |
| Species Reactivity | HumanMouse |
| Concentration | 1mg/ml |
| Purification | Affinity purified |
| Gene Symbol | NAT2 |
|---|---|
| Alternative Names | Arylamine N-acetyltransferase 2 Arylamide acetylase 2 N-acetyltransferase type 2 NAT-2 Polymorphic arylamine N-acetyltransferase PNAT NAT2 AAC2 |
| Molecular Weight(MW) | 34 kDa |
Application
Formalin-fixed and paraffin-embedded human hepatocarcinoma with NAT2 Antibody , which was peroxidase-conjugated to the secondary antibody, followed by DAB staining.
Application
Flow cytometric analysis of HepG2 cells using NAT2 Antibody (bottom histogram) compared to a negative control cell (top histogram). FITC-conjugated goat-anti-rabbit secondary antibodies were used for the analysis.
Application
Western blot analysis of NAT2 using rabbit polyclonal NAT2 Antibody using 293 cell lysates (2 ug/lane) either nontransfected (Lane 1) or transiently transfected (Lane 2) with the NAT2 gene.
Application
Western blot analysis of NAT2 Antibody in mouse kidney tissue lysates (35ug/lane)
WB
(A–L) Cropped images showed protein expression levels of CYP2C19, NAT2, NFKBIβ, EGFR, FOS, NFKB1, PPARα, RXRα, RXRβ, TPMT, UGCG, and XPC in DLD-1 WT and DLD-1 BAX–BAK DKO cells. Bar charts presented relative changes of mean gray value, which was normalized to that of β-actin.
WB
(A–L) Cropped images showed protein expression levels of CYP2C19, NAT2, NFKBIβ, EGFR, FOS, NFKB1, PPARα, RXRα, RXRβ, TPMT, UGCG, and XPC in DLD-1 WT and DLD-1 BAX–BAK DKO cells. Bar charts presented relative changes of mean gray value, which was normalized to that of β-actin.| Application Notes | For WB starting dilution is: 1:1000 For IHC-P starting dilution is: 1:10~50 For FACS starting dilution is: 1:10~50 |
|---|
| Form | Liquid |
|---|---|
| Storage Instructions | Store at 4˚C for three months and -20˚C, stable for up to one year. As with all antibodies care should be taken to avoid repeated freeze thaw cycles. Antibodies should not be exposed to prolonged high temperatures. |
| Storage Buffer | Supplied in PBS with 0.09% (W/V) sodium azide. |


