Application
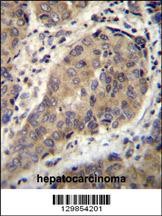
WTIP Antibody immunohistochemistry analysis in formalin fixed and paraffin embedded human hepatocarcinoma followed by peroxidase conjugation of the secondary antibody and DAB staining.Application
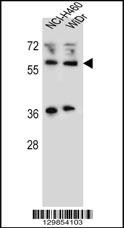
Western blot analysis in NCI-H460,WiDr cell line lysates (35ug/lane).Application
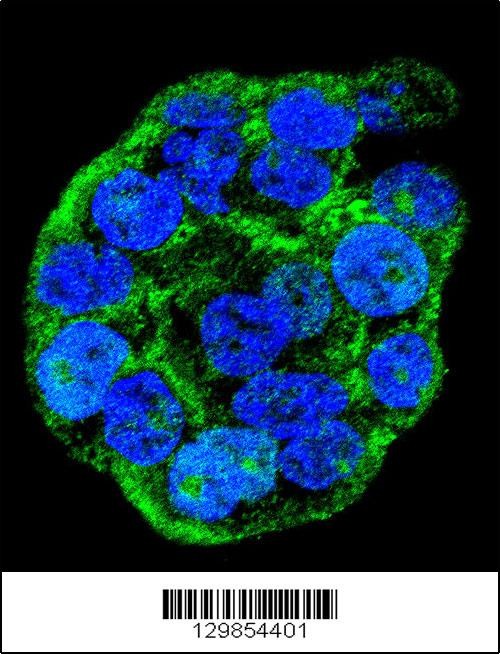
Confocal immunofluorescent analysis of WTIP Antibody with WiDr cell followed by Alexa Fluor 488-conjugated goat anti-rabbit lgG (green). DAPI was used to stain the cell nuclear (blue).WB
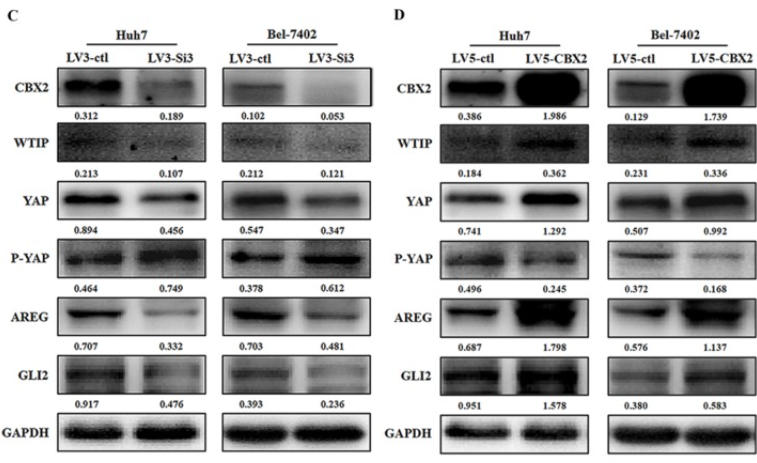
(C) CBX2 protein was decreased in LV3-Si3 cells. CBX2, WTIP, YAP, P-YAP, AREG and GLI2 protein levels in the LV3-ctl and LV3-Si3 groups of Huh7 and Bel7402 cells were determined using western blot. Band intensities were quantified using Image Lab 5.0 software and were normalized to GAPDH. The data are presented as the mean ± SD of three separate experiments (*P<0.05). (D) CBX2 protein was increased in LV5-CBX2 cells. CBX2, WTIP, YAP, P-YAP, AREG and GLI2 protein levels in the LV5-ctl and LV5-CBX2 groups of Huh7 and Bel7402 cells were determined using western blot. Band intensities were quantified using Image Lab 5.0 software and were normalized to GAPDH.WB
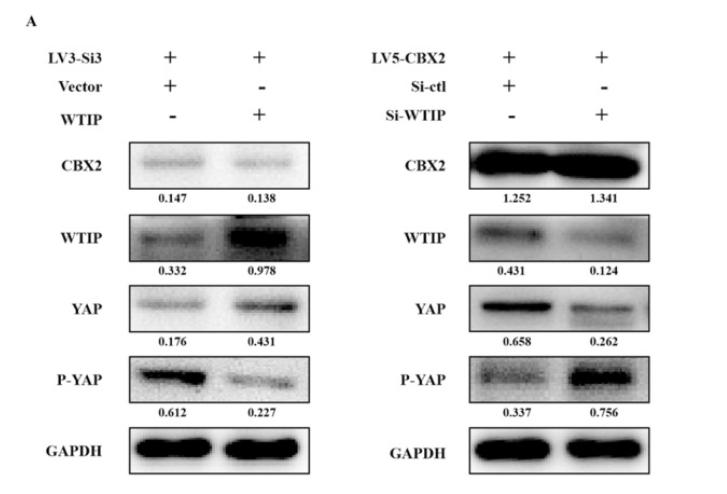
(A) Overexpression of WTIP in CBX2 knockdown Huh7 cells. CBX2, WTIP, YAP and P-YAP protein levels in the test and NC groups were determined using western blot. Knockdown of WTIP in CBX2-overexpressing Huh7 cells. CBX2, WTIP, YAP and P-YAP protein levels in the test and NC groups were determined using western blot. Band intensities were quantified using Image Lab 5.0 software and were normalized to GAPDH. The data are presented as the mean ± SD of three separate experiments (*P<0.05).IHC
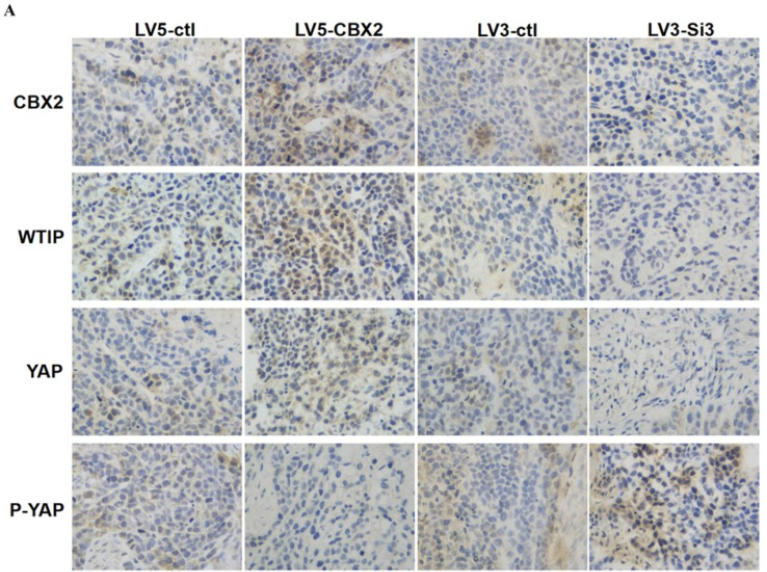
(A) Knockdown of CBX2 decreases WTIP and YAP protein levels in vivo. Upregulate of CBX2 increases WTIP and YAP protein levels in vivo. Representative IHC staining images showing the staining of CBX2, WTIP and YAP in tumors tissue samples obtained at the end point.| Product Name | WTIP Antibody |
|---|---|
| Antibody Type | Primary Antibodies |
| Product description | WTIP may monitor slit diaphragm protein assembly, a specialized adherens junction characteristic of podocytes. In case of podocyte injury, it shuttles into the nucleus and acts as a transcription regulator that represses WT1-dependent transcription regulation, thereby translating changes in slit diaphragm structure into altered gene expression and a less differentiated phenotype (By similarity). |
| Immunogen | This WTIP antibody is generated from rabbits immunized with a KLH conjugated synthetic peptide between 243-271 amino acids of human WTIP. |
| Clonality | Polyclonal |
|---|---|
| Isotype | Ig |
| Host Species | Rabbit |
| Tested Applications | IFIHCIHC-PWB |
| For IHC-P starting dilution is: 1:10~50 For WB starting dilution is: 1:1000 For IF starting dilution is: 1:10~50: |
|
| Species Reactivity | Human |
| Concentration | 1mg/ml |
| Purification | Affinity purified |
| Gene Symbol | WTIP |
|---|---|
| Alternative Names | Wilms tumor protein 1-interacting protein WT1-interacting protein WTIP |
| Molecular Weight(MW) | 45 kDa |
| Sequence Similarities | Predicted species reactivity based on immunogen sequence: Mouse |
Application
WTIP Antibody immunohistochemistry analysis in formalin fixed and paraffin embedded human hepatocarcinoma followed by peroxidase conjugation of the secondary antibody and DAB staining.
Application
Western blot analysis in NCI-H460,WiDr cell line lysates (35ug/lane).
Application
Confocal immunofluorescent analysis of WTIP Antibody with WiDr cell followed by Alexa Fluor 488-conjugated goat anti-rabbit lgG (green). DAPI was used to stain the cell nuclear (blue).
WB
(C) CBX2 protein was decreased in LV3-Si3 cells. CBX2, WTIP, YAP, P-YAP, AREG and GLI2 protein levels in the LV3-ctl and LV3-Si3 groups of Huh7 and Bel7402 cells were determined using western blot. Band intensities were quantified using Image Lab 5.0 software and were normalized to GAPDH. The data are presented as the mean ± SD of three separate experiments (*P<0.05). (D) CBX2 protein was increased in LV5-CBX2 cells. CBX2, WTIP, YAP, P-YAP, AREG and GLI2 protein levels in the LV5-ctl and LV5-CBX2 groups of Huh7 and Bel7402 cells were determined using western blot. Band intensities were quantified using Image Lab 5.0 software and were normalized to GAPDH.
WB
(A) Overexpression of WTIP in CBX2 knockdown Huh7 cells. CBX2, WTIP, YAP and P-YAP protein levels in the test and NC groups were determined using western blot. Knockdown of WTIP in CBX2-overexpressing Huh7 cells. CBX2, WTIP, YAP and P-YAP protein levels in the test and NC groups were determined using western blot. Band intensities were quantified using Image Lab 5.0 software and were normalized to GAPDH. The data are presented as the mean ± SD of three separate experiments (*P<0.05).
IHC
(A) Knockdown of CBX2 decreases WTIP and YAP protein levels in vivo. Upregulate of CBX2 increases WTIP and YAP protein levels in vivo. Representative IHC staining images showing the staining of CBX2, WTIP and YAP in tumors tissue samples obtained at the end point.| Application Notes | For IHC-P starting dilution is: 1:10~50 For WB starting dilution is: 1:1000 For IF starting dilution is: 1:10~50: |
|---|
| Form | Liquid |
|---|---|
| Storage Instructions | Store at 4˚C for three months and -20˚C, stable for up to one year. As with all antibodies care should be taken to avoid repeated freeze thaw cycles. Antibodies should not be exposed to prolonged high temperatures. |
| Storage Buffer | Supplied in PBS with 0.09% (W/V) sodium azide. |


