Application
Fig9: Flow cytometric analysis of 293T cells with NRF1 antibody at 1/100 dilution (red) compared with an unlabelled control (cells without incubation with primary antibody; black).Application
Fig9: Flow cytometric analysis of 293T cells with NRF1 antibody at 1/100 dilution (red) compared with an unlabelled control (cells without incubation with primary antibody; black).Application
Fig9: Flow cytometric analysis of 293T cells with NRF1 antibody at 1/100 dilution (red) compared with an unlabelled control (cells without incubation with primary antibody; black).Application
Fig9: Flow cytometric analysis of 293T cells with NRF1 antibody at 1/100 dilution (red) compared with an unlabelled control (cells without incubation with primary antibody; black).Application
Fig9: Flow cytometric analysis of 293T cells with NRF1 antibody at 1/100 dilution (red) compared with an unlabelled control (cells without incubation with primary antibody; black).Application
Fig9: Flow cytometric analysis of 293T cells with NRF1 antibody at 1/100 dilution (red) compared with an unlabelled control (cells without incubation with primary antibody; black).Application
Fig9: Flow cytometric analysis of 293T cells with NRF1 antibody at 1/100 dilution (red) compared with an unlabelled control (cells without incubation with primary antibody; black).Application
Fig9: Flow cytometric analysis of 293T cells with NRF1 antibody at 1/100 dilution (red) compared with an unlabelled control (cells without incubation with primary antibody; black).Application
Fig9: Flow cytometric analysis of 293T cells with NRF1 antibody at 1/100 dilution (red) compared with an unlabelled control (cells without incubation with primary antibody; black).| Product Name | NRF1 [JM89-63] |
|---|---|
| Antibody Type | Primary Antibodies |
| Antigen Alias | alpha pal antibody alpha palindromic binding protein antibody Alpha palindromic-binding protein antibody Alpha-pal antibody locus control region factor 1 antibody NFE2 related factor 1 antibody NRF-1 antibody Nrf1 antibody NRF1_HUMAN antibody Nuclear respiratory factor 1 antibody |
| Product description | The NF-E2 DNA binding protein is composed of two subunits, p45 and MafK, and it regulates expression of globin genes in developing erythroid cells through interaction with Maf recognition elements (MAREs). A family of NF-E2 related proteins, which are collectively known as the Cap 'n' collar (CNC) family and include Nrf1 (also designated TCF11), Nrf2 and Nrf3, are bZIP transcription factors that heterodimerize with Maf proteins to bind MARE sequences. The Nrf proteins also bind the antioxidant response element (ARE) and are implicated in the regulation of detoxification enzymes and the oxidative stress response. They do so by heterodimerizing with Jun family members (c-Jun, JunB and JunD) to activate gene expression, specifically the detoxifying enzyme, NQO1. Nrf2 is widely expressed and is thought to translocate to the nucleus after treatment with xenobiotics and antioxidants, which stimulate its release from a repressor protein Keap1. Nrf3 is highly expressed in placenta, B cells and monocytes. |
| Immunogen | Recombinant protein |
| Clonality | Monoclonal |
|---|---|
| Isotype | IgG |
| Host Species | Recombinant rabbit |
| Tested Applications | WBICC/IFIHCFCIP |
| WB:1:500 ICC:1:50-1:200 IHC:1:50-1:200 FC:1:50-1:100 |
|
| Species Reactivity | HumanMouseRat |
| Concentration | 1mg/ml |
| Alternative Names | alpha pal antibody alpha palindromic binding protein antibody Alpha palindromic-binding protein antibody Alpha-pal antibody locus control region factor 1 antibody NFE2 related factor 1 antibody NRF-1 antibody Nrf1 antibody NRF1_HUMAN antibody Nuclear respiratory factor 1 antibody |
|---|---|
| Molecular Weight(MW) | 56 kDa/65kDa(Observed) |
| Cellular Localization | Nucleus. |
Application
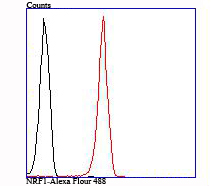
Fig9: Flow cytometric analysis of 293T cells with NRF1 antibody at 1/100 dilution (red) compared with an unlabelled control (cells without incubation with primary antibody; black).
Application
Fig9: Flow cytometric analysis of 293T cells with NRF1 antibody at 1/100 dilution (red) compared with an unlabelled control (cells without incubation with primary antibody; black).
Application
Fig9: Flow cytometric analysis of 293T cells with NRF1 antibody at 1/100 dilution (red) compared with an unlabelled control (cells without incubation with primary antibody; black).
Application
Fig9: Flow cytometric analysis of 293T cells with NRF1 antibody at 1/100 dilution (red) compared with an unlabelled control (cells without incubation with primary antibody; black).
Application
Fig9: Flow cytometric analysis of 293T cells with NRF1 antibody at 1/100 dilution (red) compared with an unlabelled control (cells without incubation with primary antibody; black).
Application
Fig9: Flow cytometric analysis of 293T cells with NRF1 antibody at 1/100 dilution (red) compared with an unlabelled control (cells without incubation with primary antibody; black).
Application
Fig9: Flow cytometric analysis of 293T cells with NRF1 antibody at 1/100 dilution (red) compared with an unlabelled control (cells without incubation with primary antibody; black).
Application
Fig9: Flow cytometric analysis of 293T cells with NRF1 antibody at 1/100 dilution (red) compared with an unlabelled control (cells without incubation with primary antibody; black).
Application
Fig9: Flow cytometric analysis of 293T cells with NRF1 antibody at 1/100 dilution (red) compared with an unlabelled control (cells without incubation with primary antibody; black).| Positive Control | Hela, mouse heart tissue lysate, MCF-7, SH-SY5Y, rat brain tissue, human tonsil tissue, human thyriod tissue, mouse colon tissue. |
|---|---|
| Application Notes | WB:1:500 ICC:1:50-1:200 IHC:1:50-1:200 FC:1:50-1:100 |
| Form | Liquid |
|---|---|
| Storage Instructions | Store at +4℃ after thawing. Aliquot store at -20℃ or -80℃. Avoid repeated freeze / thaw cycles. |
| Storage Buffer | 1*TBS (pH7.4), 1%BSA, 40%Glycerol. Preservative: 0.05% Sodium Azide. |


