Application
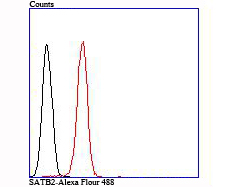
Fig9: Flow cytometric analysis of SH-SY5Y cells with SATB2 antibody at 1/100 dilution (red) compared with an unlabelled control (cells without incubation with primary antibody; black).Application
Fig9: Flow cytometric analysis of SH-SY5Y cells with SATB2 antibody at 1/100 dilution (red) compared with an unlabelled control (cells without incubation with primary antibody; black).Application
Fig9: Flow cytometric analysis of SH-SY5Y cells with SATB2 antibody at 1/100 dilution (red) compared with an unlabelled control (cells without incubation with primary antibody; black).Application
Fig9: Flow cytometric analysis of SH-SY5Y cells with SATB2 antibody at 1/100 dilution (red) compared with an unlabelled control (cells without incubation with primary antibody; black).Application
Fig9: Flow cytometric analysis of SH-SY5Y cells with SATB2 antibody at 1/100 dilution (red) compared with an unlabelled control (cells without incubation with primary antibody; black).Application
Fig9: Flow cytometric analysis of SH-SY5Y cells with SATB2 antibody at 1/100 dilution (red) compared with an unlabelled control (cells without incubation with primary antibody; black).Application
Fig9: Flow cytometric analysis of SH-SY5Y cells with SATB2 antibody at 1/100 dilution (red) compared with an unlabelled control (cells without incubation with primary antibody; black).Application
Fig9: Flow cytometric analysis of SH-SY5Y cells with SATB2 antibody at 1/100 dilution (red) compared with an unlabelled control (cells without incubation with primary antibody; black).Application
Fig9: Flow cytometric analysis of SH-SY5Y cells with SATB2 antibody at 1/100 dilution (red) compared with an unlabelled control (cells without incubation with primary antibody; black).| Product Name | SATB2 |
|---|---|
| Antibody Type | Primary Antibodies |
| Antigen Alias | DNA binding protein SATB2 antibody DNA-binding protein SATB2 antibody FLJ21474 antibody FLJ32076 antibody GLSS antibody KIAA1034 antibody MGC119474 antibody MGC119477 antibody SATB family member 2 antibody SATB homeobox 2 antibody SATB2 antibody SATB2_HUMAN antibody Special AT rich sequence binding protein 2 antibody Special AT-rich sequence-binding protein 2 antibody |
| Product description | SATB2 (Special AT-rich sequence-binding protein 2) is a nuclear matrix protein that influences craniofacial formation mechanisms, such as jaw and palate development, and is part of a transcriptional network regulating skeletal development and osteoblast differentiation. Highly expressed in adult and fetal brain, SATB2 contains two CUT DNA-binding domains and one homeobox domain and is closely related to SATB1, a transcriptional repressor. SATB2 is thought to bind to matrix-attachment regions (MARs) and regulate MAR-dependent transcription of various genes, including HoxA2 and ATF4 (CREB-2), involved in skeletal development. Functioning as both a transcriptional activator and repressor, SATB2 can also act as a protein scaffold that can enhance the activity of other DNA-binding proteins. Defects in the gene encoding SATB2 are the cause of cleft palate manifested in conjunction with severe mental retardation. |
| Immunogen | Recombinant protein |
| Clonality | Monoclonal |
|---|---|
| Isotype | IgG |
| Host Species | Recombinant rabbit |
| Tested Applications | WBICC/IFIHCFC |
| WB:1:500-1:1,000 ICC/IF:1:50-1:100 IHC:1:50-1:200 FC:1:50-1:100 |
|
| Species Reactivity | HumanMouseRat |
| Concentration | 1mg/ml |
| Alternative Names | DNA binding protein SATB2 antibody DNA-binding protein SATB2 antibody FLJ21474 antibody FLJ32076 antibody GLSS antibody KIAA1034 antibody MGC119474 antibody MGC119477 antibody SATB family member 2 antibody SATB homeobox 2 antibody SATB2 antibody SATB2_HUMAN antibody Special AT rich sequence binding protein 2 antibody Special AT-rich sequence-binding protein 2 antibody |
|---|---|
| Cellular Localization | Nucleus matrix. |
Application
Fig9: Flow cytometric analysis of SH-SY5Y cells with SATB2 antibody at 1/100 dilution (red) compared with an unlabelled control (cells without incubation with primary antibody; black).
Application
Fig9: Flow cytometric analysis of SH-SY5Y cells with SATB2 antibody at 1/100 dilution (red) compared with an unlabelled control (cells without incubation with primary antibody; black).
Application
Fig9: Flow cytometric analysis of SH-SY5Y cells with SATB2 antibody at 1/100 dilution (red) compared with an unlabelled control (cells without incubation with primary antibody; black).
Application
Fig9: Flow cytometric analysis of SH-SY5Y cells with SATB2 antibody at 1/100 dilution (red) compared with an unlabelled control (cells without incubation with primary antibody; black).
Application
Fig9: Flow cytometric analysis of SH-SY5Y cells with SATB2 antibody at 1/100 dilution (red) compared with an unlabelled control (cells without incubation with primary antibody; black).
Application
Fig9: Flow cytometric analysis of SH-SY5Y cells with SATB2 antibody at 1/100 dilution (red) compared with an unlabelled control (cells without incubation with primary antibody; black).
Application
Fig9: Flow cytometric analysis of SH-SY5Y cells with SATB2 antibody at 1/100 dilution (red) compared with an unlabelled control (cells without incubation with primary antibody; black).
Application
Fig9: Flow cytometric analysis of SH-SY5Y cells with SATB2 antibody at 1/100 dilution (red) compared with an unlabelled control (cells without incubation with primary antibody; black).
Application
Fig9: Flow cytometric analysis of SH-SY5Y cells with SATB2 antibody at 1/100 dilution (red) compared with an unlabelled control (cells without incubation with primary antibody; black).| Positive Control | THP-1, PC-12, SH-SY5Y, LOVO, rat brain tissue, human colon cancer tissue, rat large intestine tissue, mouse brain tissue. |
|---|---|
| Application Notes | WB:1:500-1:1,000 ICC/IF:1:50-1:100 IHC:1:50-1:200 FC:1:50-1:100 |
| Form | Liquid |
|---|---|
| Storage Instructions | Store at +4℃ after thawing. Aliquot store at -20℃ or -80℃. Avoid repeated freeze / thaw cycles. |
| Storage Buffer | 1*TBS (pH7.4), 1%BSA, 40%Glycerol. Preservative: 0.05% Sodium Azide. |


