Application
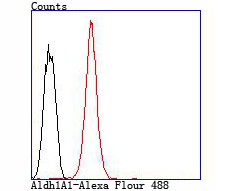
Fig10: Flow cytometric analysis of HepG2 cells with Aldh1A1 antibody at 1/100 dilution (red) compared with an unlabelled control (cells without incubation with primary antibody; black).Application
Fig10: Flow cytometric analysis of HepG2 cells with Aldh1A1 antibody at 1/100 dilution (red) compared with an unlabelled control (cells without incubation with primary antibody; black).Application
Fig10: Flow cytometric analysis of HepG2 cells with Aldh1A1 antibody at 1/100 dilution (red) compared with an unlabelled control (cells without incubation with primary antibody; black).Application
Fig10: Flow cytometric analysis of HepG2 cells with Aldh1A1 antibody at 1/100 dilution (red) compared with an unlabelled control (cells without incubation with primary antibody; black).Application
Fig10: Flow cytometric analysis of HepG2 cells with Aldh1A1 antibody at 1/100 dilution (red) compared with an unlabelled control (cells without incubation with primary antibody; black).Application
Fig10: Flow cytometric analysis of HepG2 cells with Aldh1A1 antibody at 1/100 dilution (red) compared with an unlabelled control (cells without incubation with primary antibody; black).Application
Fig10: Flow cytometric analysis of HepG2 cells with Aldh1A1 antibody at 1/100 dilution (red) compared with an unlabelled control (cells without incubation with primary antibody; black).Application
Fig10: Flow cytometric analysis of HepG2 cells with Aldh1A1 antibody at 1/100 dilution (red) compared with an unlabelled control (cells without incubation with primary antibody; black).Application
Fig10: Flow cytometric analysis of HepG2 cells with Aldh1A1 antibody at 1/100 dilution (red) compared with an unlabelled control (cells without incubation with primary antibody; black).Application
Fig10: Flow cytometric analysis of HepG2 cells with Aldh1A1 antibody at 1/100 dilution (red) compared with an unlabelled control (cells without incubation with primary antibody; black).| Product Name | Aldh1A1 |
|---|---|
| Antibody Type | Primary Antibodies |
| Antigen Alias | Acetaldehyde dehydrogenase 1 antibody AHD2 antibody AL1A1_HUMAN antibody ALDC antibody Aldehyde dehydrogenase 1 family member A1 antibody Aldehyde dehydrogenase 1 soluble antibody Aldehyde dehydrogenase 1A1 antibody Aldehyde dehydrogenase antibody Aldehyde dehydrogenase cytosolic antibody Aldehyde dehydrogenase family 1 member A1 antibody Aldehyde dehydrogenase liver cytosolic antibody ALDH 1 antibody ALDH 1A1 antibody ALDH class 1 antibody ALDH, liver cytosolic antibody ALDH-E1 antibody ALDH1 A1 antibody ALDH1 antibody ALDH11 antibody ALDH1A1 antibody ALHDII antibody cytosolic antibody epididymis luminal protein 12 antibody epididymis luminal protein 9 antibody epididymis secretory sperm binding protein Li 53e antibody HEL-S-53e antibody MGC2318 antibody PUMB1 antibody RALDH 1 antibody RalDH1 antibody Retinal dehydrogenase 1 antibody |
| Product description | Aldehyde dehydrogenases (ALDHs) mediate NADP+-dependent oxidation of aldehydes into acids during the detoxification of alcohol-derived acetaldehyde; metabolism of corticosteroids, biogenic amines and neurotransmitters; and lipid peroxidation. ALDH1A1, also designated retinal dehydrogenase 1 (RalDH1 or RALDH1), aldehyde dehydrogenase family 1 member A1, aldehyde dehydrogenase cytosolic, ALDHII, ALDH-E1 or ALDH E1, is a retinal dehydrogenase that participates in the biosynthesis of retinoic acid (RA). There are two major liver isoforms of ALDH1 that can localize to cytosolic or mitochondrial space. The ALDH1A2 (RALDH2, RALDH2-T) gene produces three different transcripts and also catalyzes the synthesis of RA from retinaldehyde. ALDH1A3 (ALDH6, RALDH3, ALDH1A6) is a 37 kb gene that consists of 13 exons and produces a major transcript of approximately 3.5 kb most abundant in salivary gland, stomach and kidney. ALDH3A1 (stomach type, ALDH3, ALDHIII) forms a cytoplasmic homodimer that preferentially oxidizes aromatic aldehyde substrates. ALDH genes upregulate as a part of the oxidative stress response, and appear to be abundant in certain tumors that have an accelerated metabolism toward chemotherapy agents. |
| Immunogen | Peptide |
| Clonality | Polyclonal |
|---|---|
| Isotype | IgG |
| Host Species | Rabbit |
| Tested Applications | WBICCIHCFC |
| WB:1:500-1:1000 ICC:1:50-1:200 IHC:1:50-1:200 FC:1:50-1:200 |
|
| Species Reactivity | HumanMouseRat |
| Concentration | 1mg/ml |
| Alternative Names | Acetaldehyde dehydrogenase 1 antibody
AHD2 antibody
AL1A1_HUMAN antibody
ALDC antibody
Aldehyde dehydrogenase 1 family member A1 antibody
Aldehyde dehydrogenase 1 soluble antibody
Aldehyde dehydrogenase 1A1 antibody
Aldehyde dehydrogenase antibody
Aldehyde dehydrogenase cytosolic antibody
Aldehyde dehydrogenase family 1 member A1 antibody
Aldehyde dehydrogenase liver cytosolic antibody
ALDH 1 antibody
ALDH 1A1 antibody
ALDH class 1 antibody
ALDH liver cytosolic antibody ALDH-E1 antibody ALDH1 A1 antibody ALDH1 antibody ALDH11 antibody ALDH1A1 antibody ALHDII antibody cytosolic antibody epididymis luminal protein 12 antibody epididymis luminal protein 9 antibody epididymis secretory sperm binding protein Li 53e antibody HEL-S-53e antibody MGC2318 antibody PUMB1 antibody RALDH 1 antibody RalDH1 antibody Retinal dehydrogenase 1 antibody |
|---|---|
| Molecular Weight(MW) | 55 kDa |
| Cellular Localization | Cytoplasm. |
Application
Fig10: Flow cytometric analysis of HepG2 cells with Aldh1A1 antibody at 1/100 dilution (red) compared with an unlabelled control (cells without incubation with primary antibody; black).
Application
Fig10: Flow cytometric analysis of HepG2 cells with Aldh1A1 antibody at 1/100 dilution (red) compared with an unlabelled control (cells without incubation with primary antibody; black).
Application
Fig10: Flow cytometric analysis of HepG2 cells with Aldh1A1 antibody at 1/100 dilution (red) compared with an unlabelled control (cells without incubation with primary antibody; black).
Application
Fig10: Flow cytometric analysis of HepG2 cells with Aldh1A1 antibody at 1/100 dilution (red) compared with an unlabelled control (cells without incubation with primary antibody; black).
Application
Fig10: Flow cytometric analysis of HepG2 cells with Aldh1A1 antibody at 1/100 dilution (red) compared with an unlabelled control (cells without incubation with primary antibody; black).
Application
Fig10: Flow cytometric analysis of HepG2 cells with Aldh1A1 antibody at 1/100 dilution (red) compared with an unlabelled control (cells without incubation with primary antibody; black).
Application
Fig10: Flow cytometric analysis of HepG2 cells with Aldh1A1 antibody at 1/100 dilution (red) compared with an unlabelled control (cells without incubation with primary antibody; black).
Application
Fig10: Flow cytometric analysis of HepG2 cells with Aldh1A1 antibody at 1/100 dilution (red) compared with an unlabelled control (cells without incubation with primary antibody; black).
Application
Fig10: Flow cytometric analysis of HepG2 cells with Aldh1A1 antibody at 1/100 dilution (red) compared with an unlabelled control (cells without incubation with primary antibody; black).
Application
Fig10: Flow cytometric analysis of HepG2 cells with Aldh1A1 antibody at 1/100 dilution (red) compared with an unlabelled control (cells without incubation with primary antibody; black).| Positive Control | 2 liver tissue lysate, 2 kidney tissue lysate, 293T, A431, HepG2, human liver tissue, human lung tissue, human kidney tissue, 2 colon tissue, A549. |
|---|---|
| Application Notes | WB:1:500-1:1000 ICC:1:50-1:200 IHC:1:50-1:200 FC:1:50-1:200 |
| Form | Liquid |
|---|---|
| Storage Instructions | Store at +4℃ after thawing. Aliquot store at -20℃ or -80℃. Avoid repeated freeze / thaw cycles. |
| Storage Buffer | 1*TBS (pH7.4), 1%BSA, 40%Glycerol. Preservative: 0.05% Sodium Azide. |


