Application
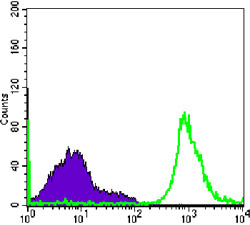
Figure 1: Flow cytometric analysis of Raji cells using CD19 mouse mAb (green) and negative control (purple).Application
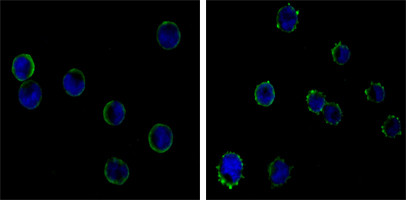
Figure 2:Immunofluorescence analysis of HL-60(left) and K562(right) cells using CD19 mouse mAb (green). Blue: DRAQ5 fluorescent DNA dye.| Product Name | CD19 Antibody |
|---|---|
| Antibody Type | Primary Antibodies |
| Clonality | Monoclonal |
|---|---|
| Isotype | IgG1 |
| Clone Number | 200 |
| Host Species | Mouse |
| Tested Applications | FCIF |
| FC:1:200 - 400. |
|
| Species Reactivity | Human |
| Concentration | 1mg/ml |
| Alternative Names | B4 MGC12802 |
|---|---|
| Molecular Weight(MW) | 61128 Da |
| Function | Assembles with the antigen receptor of B-lymphocytes in order to decrease the threshold for antigen receptor-dependent stimulation |
| Tissue Specificity | Purified recombinant fragment of human CD19 expressed in E. Coli. |
| Cellular Localization | Membrane; Single-pass type I membrane protein |
| Entrez Gene | 930 |
|---|---|
| Nucleotide Accession | NP_001761.3 |
Application
Figure 1: Flow cytometric analysis of Raji cells using CD19 mouse mAb (green) and negative control (purple).
Application
Figure 2:Immunofluorescence analysis of HL-60(left) and K562(right) cells using CD19 mouse mAb (green). Blue: DRAQ5 fluorescent DNA dye.| Application Notes | FC:1:200 - 400. |
|---|
| Form | Liquid |
|---|---|
| Storage Instructions | For short-term storage, store at 4° C. For long-term storage, aliquot and store at -20ºC or below. Avoid multiple freeze-thaw cycles. |
| Storage Buffer | Purified recombinant fragment of human CD19 expressed in E. Coli. |


