
Application
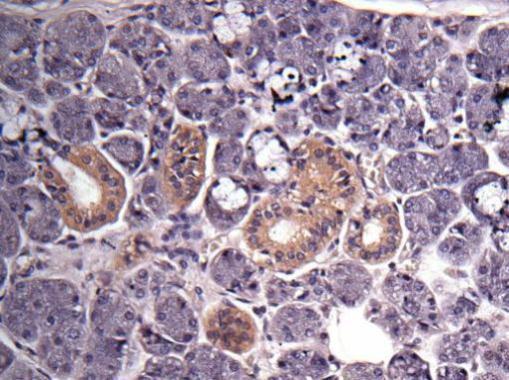
Immunohistochemical analysis of human salivary gland cancer, using GAPDH antibody at 1:500 dilution.Application
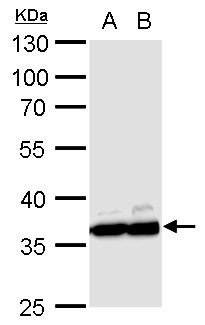
GAPDH antibody detects GAPDH protein by western blot analysis. A. 30 µg PC-12 whole cell lysate/extract B. 30 µg Rat2 whole cell lysate/extract 10% SDS-PAGE GAPDH antibody dilution: 1:10000 The HRP-conjugated anti-rabbit IgG antibody was used to detect the primary antibody.Application
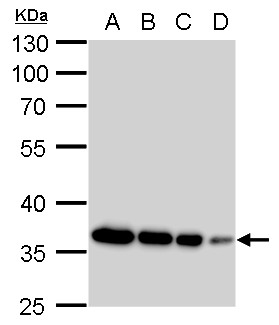
GAPDH antibody detects GAPDH protein by western blot analysis. A. 20 µg 293T whole cell lysate/extract B. 10 µg 293T whole cell lysate/extract C. 5 µg 293T whole cell lysate/extract D. 1 µg 293T whole cell lysate/extract 10% SDS-PAGE GAPDH antibody dilution: 1:10000 The HRP-conjugated anti-rabbit IgG antibody was used to detect the primary antibody.Application
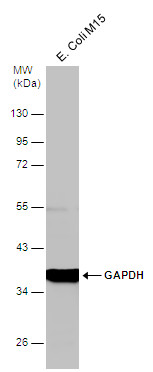
Whole cell extract (30 µg) was separated by 10% SDS-PAGE, and the membrane was blotted with GAPDH antibody diluted at 1:5000. The HRP-conjugated anti-rabbit IgG antibody was used to detect the primary antibody.Application
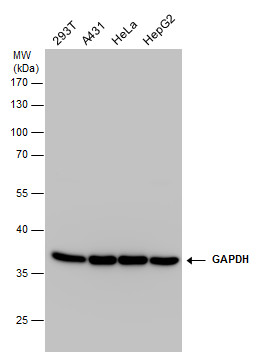
GAPDH antibody detects GAPDH protein by western blot analysis. Various whole cell extracts (30 µg) were separated by 10% SDS-PAGE, and the membrane was blotted with GAPDH antibody diluted at a dilution of 1:100000. The HRP-conjugated anti-rabbit IgG antibody was used to detect the primary antibody.Application
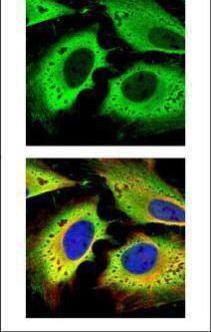
Confocal immunofluorescence analysis (Olympus FV10i) of paraformaldehyde-fixed HeLa, using GAPDH antibody (green) at 1:500 dilution. Alpha-tubulin filaments were labeled with (red) at 1:2000.Application
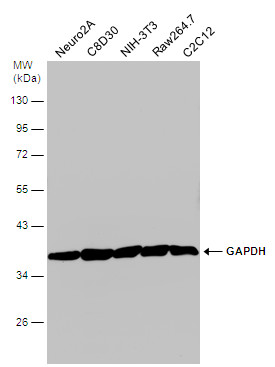
Various whole cell extracts (30 µg) were separated by 10% SDS-PAGE, and the membrane was blotted with GAPDH antibody diluted at 1:6000. The HRP-conjugated anti-rabbit IgG antibody was used to detect the primary antibody.Application
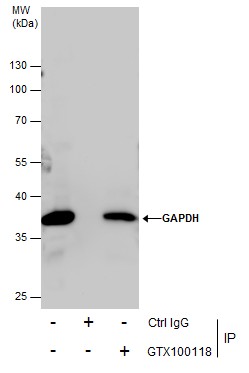
Immunoprecipitation of GAPDH protein from 293T whole cell extracts using 5 μg of GAPDH antibody . Western blot analysis was performed using GAPDH antibody . EasyBlot anti-Rabbit IgG was used as a secondary reagent.Application
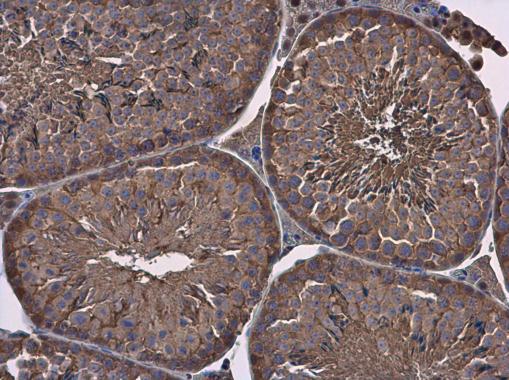
GAPDH antibody detects GAPDH protein at cytoplasm in mouse testis by immunohistochemical analysis. Sample: Paraffin-embedded mouse testis. GAPDH antibody diluted at 1:500.Application
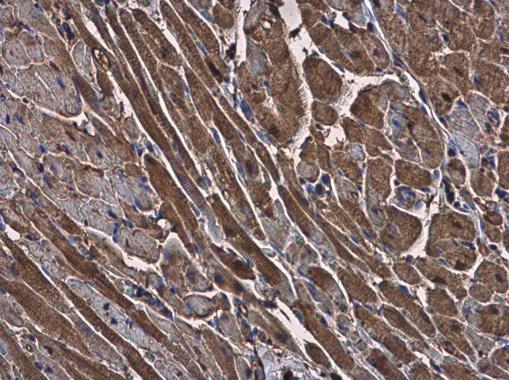
GAPDH antibody detects GAPDH protein at cytoplasm in rat heart by immunohistochemical analysis. Sample: Paraffin-embedded rat heart. GAPDH antibody diluted at 1:500.WB
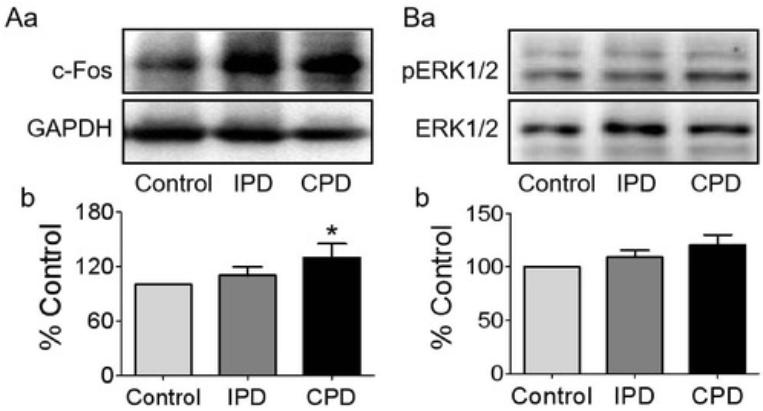
(A and B) Western blotting bands (a) and their statistical analyses (b) of c-Fos (A, n = 6) and pERK1/2 (B, n = 7).WB
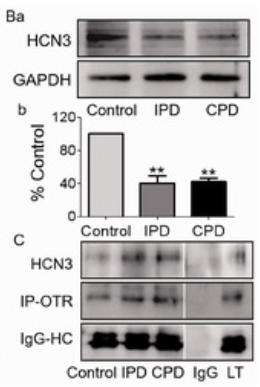
(B) Western blotting bands (a) and the summary graph (b) (n = 6). (C) Protein bands showing coimmunoprecipitation of OTR with HCN3. The noncontiguous gel lanes are reassembled from two sections of the same protein membrane after removal of irrelevant bands. Note: IgG and total lysate (TL): negative and positive controls, respectively; IgG-HC, IgG heavy chain. **p< .01 versus control by ANOVA.WB
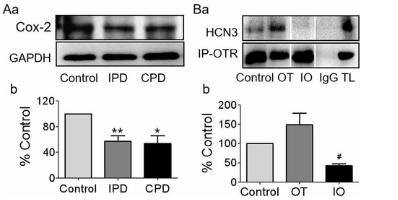
Effects of PD on the Expressions of Cox-2 and its Influences on OT-Modulated Molecular Association Between OTR and HCN3 in the SON. (A) Western blotting bands (a) and the summary graphs (b) displaying PD effects on the expression of Cox-2 (n = 7). (B) Representative protein bands showing coimmunoprecipitation of OTR with HCN3 in the SON of brain slices (a) and the summary graph (b, n = 4), respectively. The noncontiguous gel lanes are reassembled from two sections of the same protein membrane after removal of irrelevant bands. #p < .05 compared with OT by ANOVA. *p < .05, **p < .01 versus control by ANOVA.WB
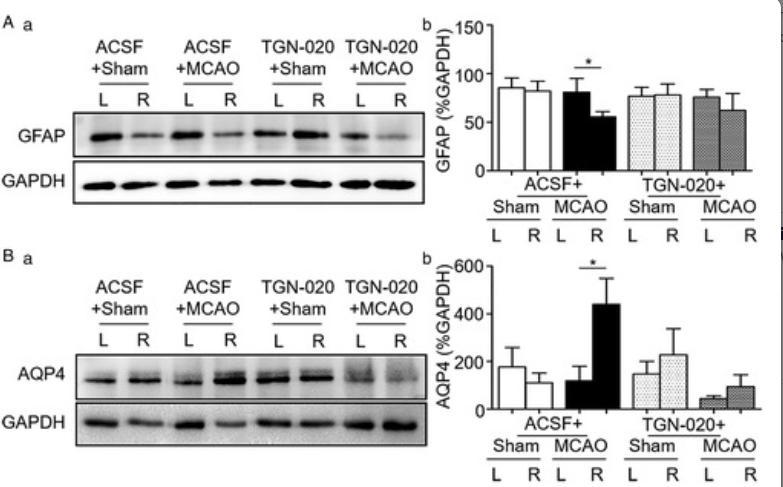
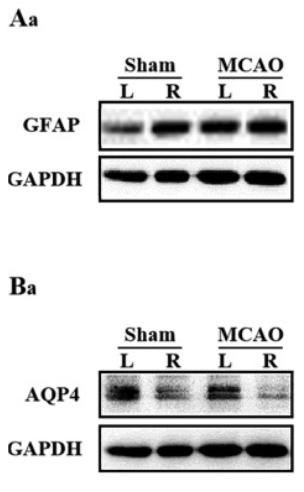
A and B: Representative Western blotting bands (a) and bar graphs (b) summarizing the expression of GFAP (A) and AQP4 (B) in the cortex of sham and MCAO rats.WB
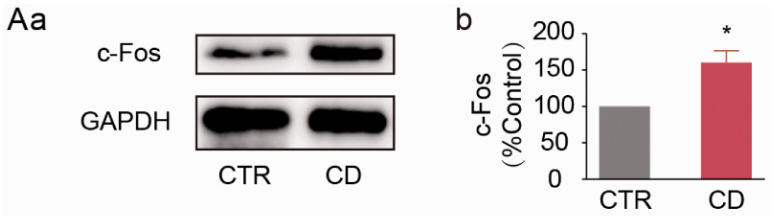
A: Representative Western blotting bands (a) and the summary graph (b) showing c-Fos protein expression at day 5.WB
(B–D). Western blot bands (a) and the bar-graphs showing the effects of IPD and CPD on the expression of OTR (B), Gβ subunit (C) and Gαq subunit (D) respectively.WB
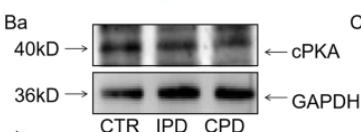
(B). Western blotting bands (a) and the bar-graphWB
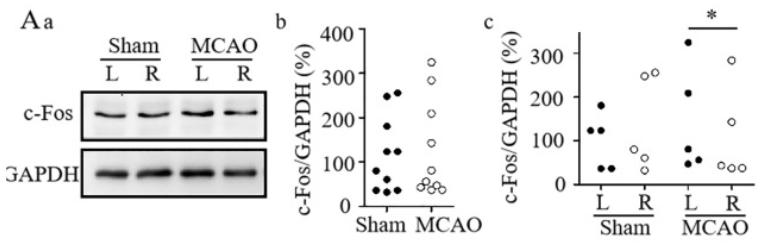
A. Representative Western blotting bands (a) and graphs showing effects of MCAO on c-Fos expression in whole SON (b) and at different sides in sham and MCAO rats (c). *P < 0.05 between two sides.WB
A and B. Western blotting bands (a) and the graphs summarizing the expression of GFAP (A) and AQP4 (B) in sham vs.WB
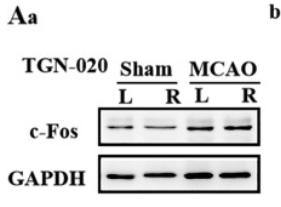
A. Representative Western blotting bands (a) and graphs summarizing the expression of c-Fos in the SON in sham vs. MCAO rats in whole SONWB
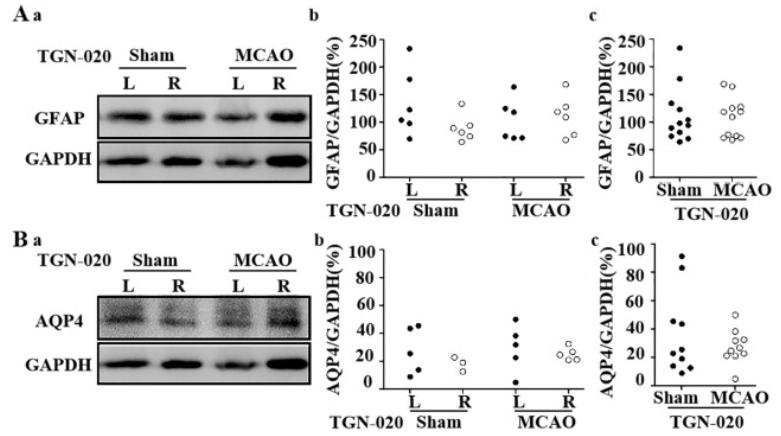
A and B. Western blotting bands (a) and graphs showing the expression of GFAP (A) and AQP4 (B) at different sides (b) and in sham and MCAO rats in whole SON (c).WB
A and B. Western blotting bands (A) and the summary graphs (B) showing the effects of microinjection of aCSF or TGN-020, respectively.| Product Name | GAPDH antibody |
|---|---|
| Antibody Type | Primary Antibodies |
| Product description | Rabbit Polyclonal antibody to GAPDH (glyceraldehyde-3-phosphate dehydrogenase)The product of this gene catalyzes an important energy-yielding step in carbohydrate metabolism, the reversible oxidative phosphorylation of glyceraldehyde-3-phosphate in the presence of inorganic phosphate and nicotinamide adenine dinucleotide (NAD). The enzyme exists as a tetramer of identical chains. Many pseudogenes similar to this locus are present in the human genome. [provided by RefSeq] |
| Immunogen | Recombinant protein encompassing a sequence within the center region of human GAPDH. The exact sequence is proprietary. |
| Clonality | Polyclonal |
|---|---|
| Isotype | IgG |
| Host Species | Rabbit |
| Tested Applications | IBICC/IFIHC-PIHC-RIPWB |
| *Optimal dilutions/concentrations should be determined by the researcher. | |
| Species Reactivity | BovineDogDrosophilaE.coliHumanMouseRat |
| Predicted Reactivity | Xenopus laevis, Cat, Pig, Rabbit, Chicken, Sheep, Rhesus Monkey, Guinea pigXenopus laevis (85%), Cat (96%), Pig (95%), Rabbit (94%), Chicken (92%), Sheep (94%), Rhesus Monkey (99%), Guinea pig (94%) |
| Concentration | 1mg/ |
| Purification | Affinity purified |
| Gene Synonyms | G3PD antibody, GAPD antibody, MGC88685 antibody, GAPDH antibody, glyceraldehyde-3-phosphate dehydrogenase antibody, aging-associated gene 9 protein antibody, glyceraldehyde 3-phosphate dehydrogenase antibody, peptidyl-cysteine S-nitrosylase GAPDH antibody |
|---|---|
| Molecular Weight(MW) | 36 kDa (note) (3) |
| Cellular Localization | Cytoplasm , perinuclear region , Membrane |
Application
Immunohistochemical analysis of human salivary gland cancer, using GAPDH antibody at 1:500 dilution.
Application
GAPDH antibody detects GAPDH protein by western blot analysis. A. 30 µg PC-12 whole cell lysate/extract B. 30 µg Rat2 whole cell lysate/extract 10% SDS-PAGE GAPDH antibody dilution: 1:10000 The HRP-conjugated anti-rabbit IgG antibody was used to detect the primary antibody.
Application
GAPDH antibody detects GAPDH protein by western blot analysis. A. 20 µg 293T whole cell lysate/extract B. 10 µg 293T whole cell lysate/extract C. 5 µg 293T whole cell lysate/extract D. 1 µg 293T whole cell lysate/extract 10% SDS-PAGE GAPDH antibody dilution: 1:10000 The HRP-conjugated anti-rabbit IgG antibody was used to detect the primary antibody.
Application
Whole cell extract (30 µg) was separated by 10% SDS-PAGE, and the membrane was blotted with GAPDH antibody diluted at 1:5000. The HRP-conjugated anti-rabbit IgG antibody was used to detect the primary antibody.
Application
GAPDH antibody detects GAPDH protein by western blot analysis. Various whole cell extracts (30 µg) were separated by 10% SDS-PAGE, and the membrane was blotted with GAPDH antibody diluted at a dilution of 1:100000. The HRP-conjugated anti-rabbit IgG antibody was used to detect the primary antibody.
Application
Confocal immunofluorescence analysis (Olympus FV10i) of paraformaldehyde-fixed HeLa, using GAPDH antibody (green) at 1:500 dilution. Alpha-tubulin filaments were labeled with (red) at 1:2000.
Application
Various whole cell extracts (30 µg) were separated by 10% SDS-PAGE, and the membrane was blotted with GAPDH antibody diluted at 1:6000. The HRP-conjugated anti-rabbit IgG antibody was used to detect the primary antibody.
Application
Immunoprecipitation of GAPDH protein from 293T whole cell extracts using 5 μg of GAPDH antibody . Western blot analysis was performed using GAPDH antibody . EasyBlot anti-Rabbit IgG was used as a secondary reagent.
Application
GAPDH antibody detects GAPDH protein at cytoplasm in mouse testis by immunohistochemical analysis. Sample: Paraffin-embedded mouse testis. GAPDH antibody diluted at 1:500.
Application
GAPDH antibody detects GAPDH protein at cytoplasm in rat heart by immunohistochemical analysis. Sample: Paraffin-embedded rat heart. GAPDH antibody diluted at 1:500.
WB
(A and B) Western blotting bands (a) and their statistical analyses (b) of c-Fos (A, n = 6) and pERK1/2 (B, n = 7).
WB
(B) Western blotting bands (a) and the summary graph (b) (n = 6). (C) Protein bands showing coimmunoprecipitation of OTR with HCN3. The noncontiguous gel lanes are reassembled from two sections of the same protein membrane after removal of irrelevant bands. Note: IgG and total lysate (TL): negative and positive controls, respectively; IgG-HC, IgG heavy chain. **p< .01 versus control by ANOVA.
WB
Effects of PD on the Expressions of Cox-2 and its Influences on OT-Modulated Molecular Association Between OTR and HCN3 in the SON. (A) Western blotting bands (a) and the summary graphs (b) displaying PD effects on the expression of Cox-2 (n = 7). (B) Representative protein bands showing coimmunoprecipitation of OTR with HCN3 in the SON of brain slices (a) and the summary graph (b, n = 4), respectively. The noncontiguous gel lanes are reassembled from two sections of the same protein membrane after removal of irrelevant bands. #p < .05 compared with OT by ANOVA. *p < .05, **p < .01 versus control by ANOVA.
WB
A and B: Representative Western blotting bands (a) and bar graphs (b) summarizing the expression of GFAP (A) and AQP4 (B) in the cortex of sham and MCAO rats.
WB
A: Representative Western blotting bands (a) and the summary graph (b) showing c-Fos protein expression at day 5.
WB
(B–D). Western blot bands (a) and the bar-graphs showing the effects of IPD and CPD on the expression of OTR (B), Gβ subunit (C) and Gαq subunit (D) respectively.
WB
(B). Western blotting bands (a) and the bar-graph
WB
A. Representative Western blotting bands (a) and graphs showing effects of MCAO on c-Fos expression in whole SON (b) and at different sides in sham and MCAO rats (c). *P < 0.05 between two sides.
WB
A and B. Western blotting bands (a) and the graphs summarizing the expression of GFAP (A) and AQP4 (B) in sham vs.
WB
A. Representative Western blotting bands (a) and graphs summarizing the expression of c-Fos in the SON in sham vs. MCAO rats in whole SON
WB
A and B. Western blotting bands (a) and graphs showing the expression of GFAP (A) and AQP4 (B) at different sides (b) and in sham and MCAO rats in whole SON (c).
WB
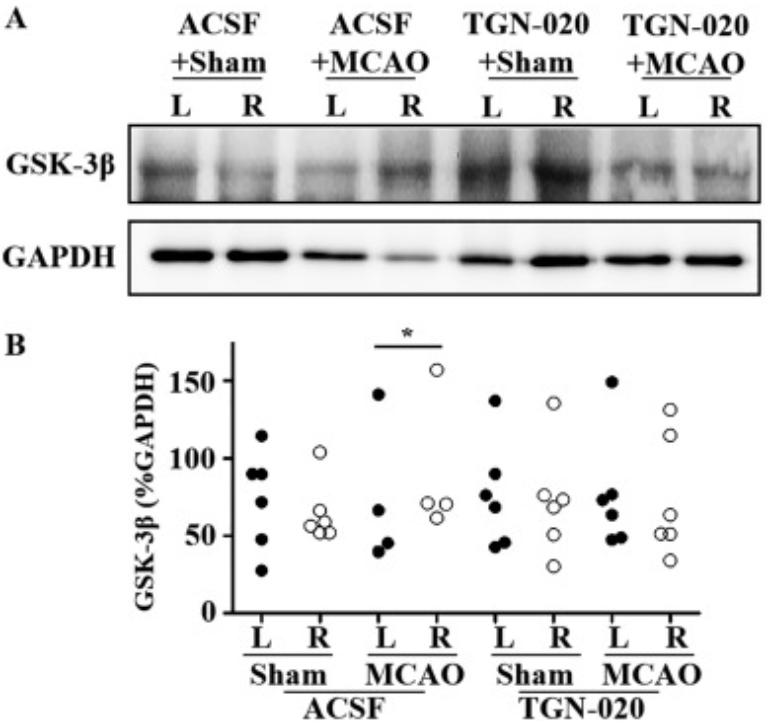
A and B. Western blotting bands (A) and the summary graphs (B) showing the effects of microinjection of aCSF or TGN-020, respectively.| Application Notes | *Optimal dilutions/concentrations should be determined by the researcher. |
|---|
| Form | Liquid |
|---|---|
| Storage Instructions | Keep as concentrated solution. Aliquot and store at -20ºC or below. Avoid multiple freeze-thaw cycles. |
| Storage Buffer | 1XPBS, 20% Glycerol (pH7). 0.025% ProClin 300 was added as a preservative. |


