Application
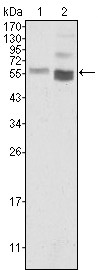
Figure 1: Western blot analysis using anti-PTEN monoclonal antibody against Hela (1) and NIH/3T3 (2) cell lysate.Application
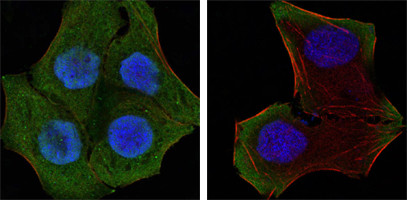
Figure 2: Confocal immunofluorescence analysis of Hela (left) and HepG2 (right) cells using anti-PTEN mAb (green). Red: Actin filaments have been labeled with DY-554 phalloidin. Blue: DRAQ5 fluorescent DNA dye.Application
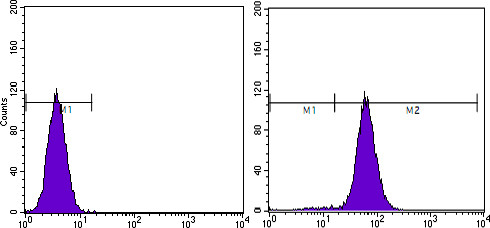
Figure 4: Flow cytometric analysis of Hela cells using anti-PTEN mAb (right) and negative control (left).| Product Name | PTEN Antibody |
|---|---|
| Antibody Type | Primary Antibodies |
| Antigen Alias | BZS; MHAM; TEP1; PTEN1 |
| Clonality | Monoclonal |
|---|---|
| Isotype | IgG1 |
| Clone Number | 1B8 |
| Host Species | Mouse |
| Tested Applications | WBIFFC |
| WB:1:500 - 2000. IF |
|
| Species Reactivity | Human |
| Concentration | 1mg/ml |
| Gene Synonyms | MMAC1 TEP1 |
|---|---|
| Alternative Names | BZS MHAM TEP1 PTEN1 |
| Molecular Weight(MW) | 47166 Da |
| Function | Tumor suppressor. Acts as a dual-specificity protein phosphatase, dephosphorylating tyrosine-, serine- and threonine- phosphorylated proteins. Also acts as a lipid phosphatase, removing the phosphate in the D3 position of the inositol ring from phosphatidylinositol 3,4,5-trisphosphate, phosphatidylinositol 3,4-diphosphate, phosphatidylinositol 3- phosphate and inositol 1,3,4,5-tetrakisphosphate with order of substrate preference in vitro PtdIns(3,4,5)P3 > PtdIns(3,4)P2 > PtdIns3P > Ins(1,3,4,5)P4. The lipid phosphatase activity is critical for its tumor suppressor function. Antagonizes the PI3K- AKT/PKB signaling pathway by dephosphorylating phosphoinositides and thereby modulating cell cycle progression and cell survival The unphosphorylated form cooperates with AIP1 to suppress AKT1 activation. Dephosphorylates tyrosine-phosphorylated focal adhesion kinase and inhibits cell migration and integrin-mediated cell spreading and focal adhesion formation. Plays a role as a key modulator of the AKT-mTOR signaling pathway controlling the tempo of the process of newborn neurons integration during adult neurogenesis, including correct neuron positioning, dendritic development and synapse formation. May be a negative regulator of insulin signaling and glucose metabolism in adipose tissue. The nuclear monoubiquitinated form possesses greater apoptotic potential, whereas the cytoplasmic nonubiquitinated form induces less tumor suppressive ability |
| Tissue Specificity | Expressed at a relatively high level in all adult tissues, including heart, brain, placenta, lung, liver, muscle, kidney and pancreas |
| Cellular Localization | Cytoplasm. Nucleus. Nucleus, PML body. Note=Monoubiquitinated form is nuclear. Nonubiquitinated form is cytoplasmic. Colocalized with PML and USP7 in PML nuclear bodies XIAP/BIRC4 promotes its nuclear localization |
| Entrez Gene | 5728 |
|---|---|
| Nucleotide Accession | NP_000305.3 |
Application
Figure 1: Western blot analysis using anti-PTEN monoclonal antibody against Hela (1) and NIH/3T3 (2) cell lysate.
Application
Figure 2: Confocal immunofluorescence analysis of Hela (left) and HepG2 (right) cells using anti-PTEN mAb (green). Red: Actin filaments have been labeled with DY-554 phalloidin. Blue: DRAQ5 fluorescent DNA dye.
Application
Figure 4: Flow cytometric analysis of Hela cells using anti-PTEN mAb (right) and negative control (left).| Application Notes | WB:1:500 - 2000. IF |
|---|
| Form | Liquid |
|---|---|
| Storage Instructions | For short-term storage, store at 4° C. For long-term storage, aliquot and store at -20ºC or below. Avoid multiple freeze-thaw cycles. |
| Storage Buffer | Purified recombinant fragment of PTEN expressed in E. Coli. |


