Application
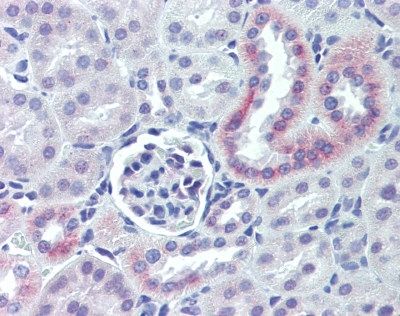
IHC-P analysis of mouse kidney tissue using Nestin antibody.Application
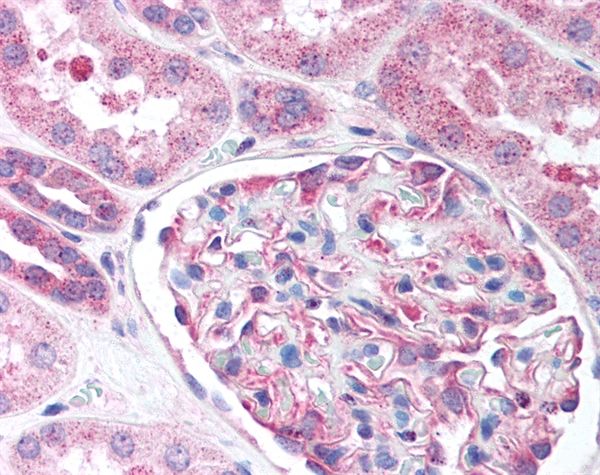
IHC-P analysis of human kidney tissue using Nestin antibody.IHC
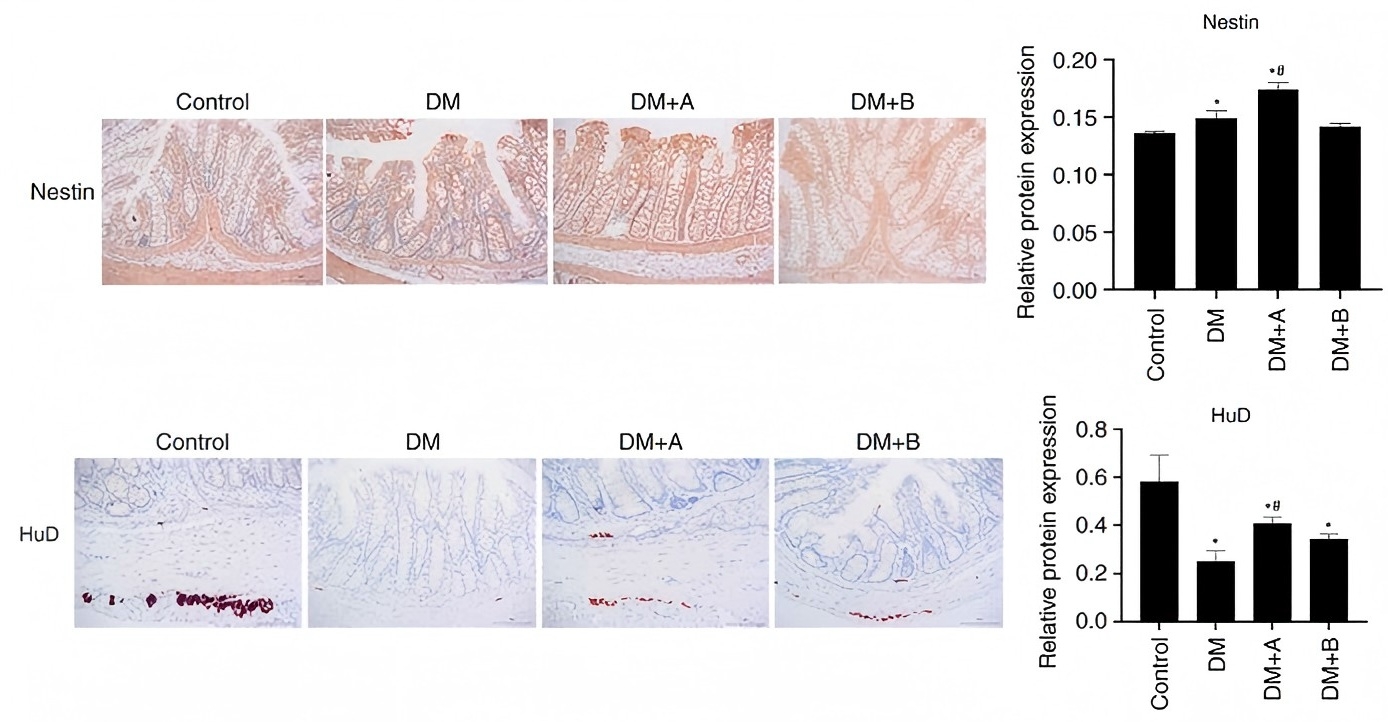
Figure 2 - Nestin and HuD expression in the Control, DM, DM + A and DM + B groups, as determined via immunohistochemical analysis. Nuclei and Nestin/HuD were labeled as blue and brown, respectively. A rat model of DM was established using an intraperitoneal injection of streptozotocin. The rats in the Control group were given an equal volume of citric acid solvent. Magnification, ×200. *P<0.05 vs. Control; #P<0.05 vs. DM. DM, diabetes mellitus model; DM + A, diabetic rats treated with 5 µg/kg prucalopride; DM + B, diabetic rats treated with 10 µg/kg prucalopride; HuD, RNA-binding protein human antigen D.IHC
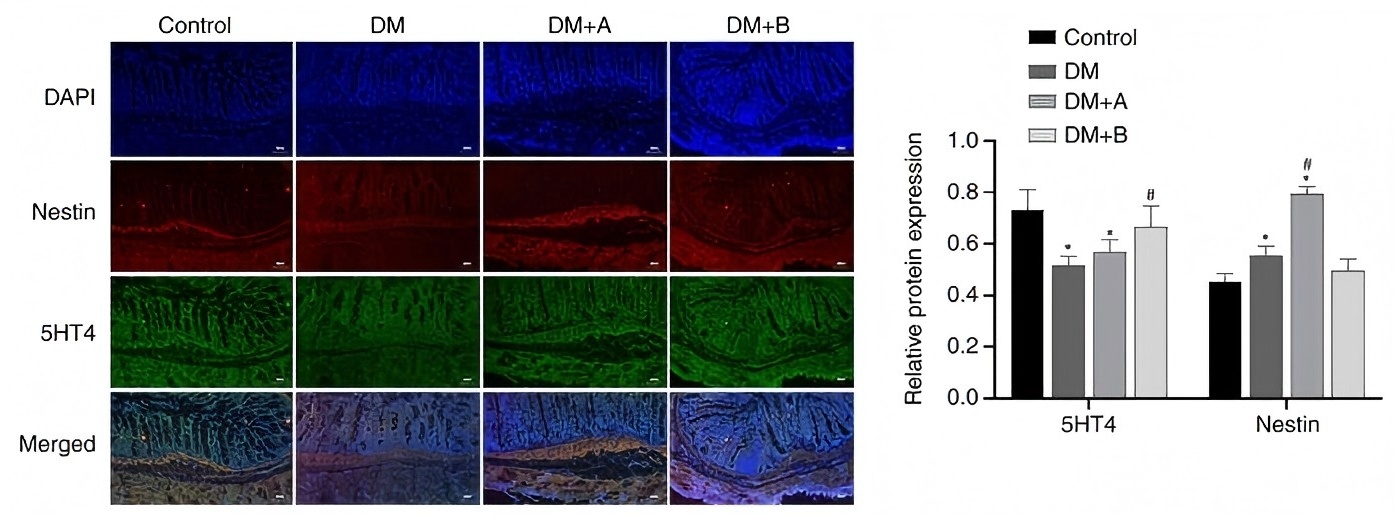
Figure 5 - Immunofluorescence double staining images of Nestin and 5-HT4 in the Control, DM, DM + A and DM + B groups. DAPI-stained nuclei appeared blue. Nestin and 5-HT4 are indicated by red fluorescence and green fluorescence, respectively. A rat model of DM was established using an intraperitoneal injection of streptozotocin. The rats in the Control group were given an equal volume of citric acid solvent. Magnification, ×100. *P<0.05 vs. Control; #P<0.05 vs. DM. DM, diabetes mellitus model; DM + A, diabetic rats treated with 5 µg/kg prucalopride; DM + B, diabetic rats treated with 10 µg/kg prucalopride; 5-HT4, 5-hydroxytryptamine 4.IHC
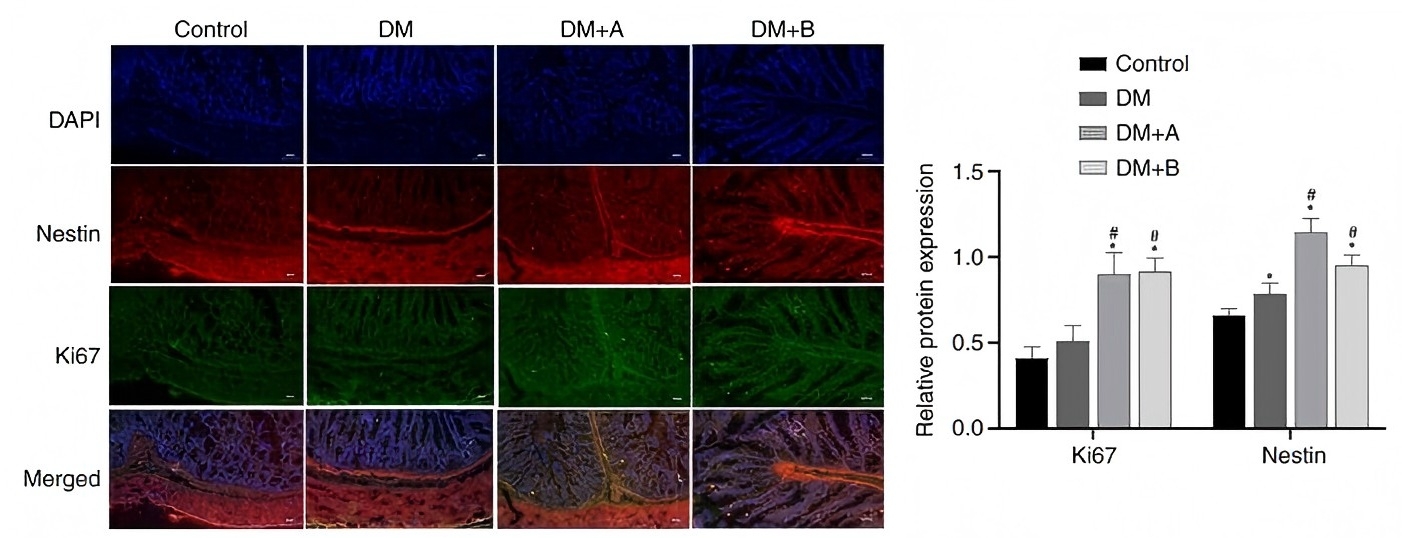
Figure 6 - Immunofluorescence double staining images of Nestin and Ki67 in the Control, DM, DM + A and DM + B groups. DAPI-stained nuclei appeared blue. Nestin and Ki67 are indicated by red fluorescence and green fluorescence, respectively. A rat model of DM was established using an intraperitoneal injection of streptozotocin. The rats in the Control group were given an equal volume of citric acid solvent. Magnification, ×100. *P<0.05 vs. Control; #P<0.05 vs. DM. DM, diabetes mellitus model; DM + A, diabetic rats treated with 5 µg/kg prucalopride; DM + B, diabetic rats treated with 10 µg/kg prucalopride.IF
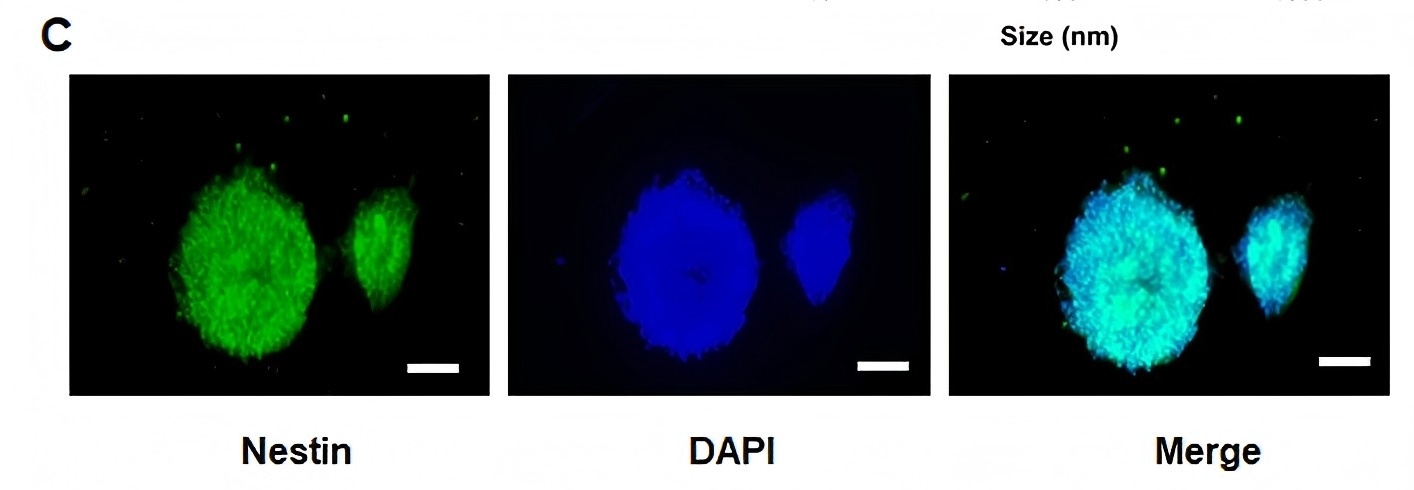
(C) Identification of NSCs isolated from the hippocampus of embryonic Sprague-Dawley rats. Successful isolation of NSCs was indicated by 98% of the cells being nestin-positive (scale bar, 100 µm).| Product Name | Nestin antibody |
|---|---|
| Antibody Type | Primary Antibodies |
| Product description | Rabbit polyclonal antibody to Nestin |
| Immunogen | Recombinant human Nestin (aa1484-1500). |
| Conjugation | Agarose |
| Modification | Acetylated |
| Clonality | Polyclonal |
|---|---|
| Isotype | IgG |
| Host Species | Rabbit |
| Tested Applications | ELISAICC/IFIFIHCIHC-PWB |
| *Optimal dilutions/concentrations should be determined by the researcher.: ELISA: 1:20000 ~ 1:80000 WB:1:500~1:1000 IHC:1:50~1:100 |
|
| Species Reactivity | BovineDogHamsterHumanMacaque MonkeyMouseRabbitRat |
| Concentration | 1mg/ml |
| Purification | Affinity purified |
| Gene Synonyms | Nes C78523 ESTM46 nestin AA166324 |
|---|---|
| Target | Nestin |
| Molecular Weight(MW) | 177 kDa |
| Tissue Specificity | This antibody recognizes human Nestin. |
Application
IHC-P analysis of mouse kidney tissue using Nestin antibody.
Application
IHC-P analysis of human kidney tissue using Nestin antibody.
IHC
Figure 2 - Nestin and HuD expression in the Control, DM, DM + A and DM + B groups, as determined via immunohistochemical analysis. Nuclei and Nestin/HuD were labeled as blue and brown, respectively. A rat model of DM was established using an intraperitoneal injection of streptozotocin. The rats in the Control group were given an equal volume of citric acid solvent. Magnification, ×200. *P<0.05 vs. Control; #P<0.05 vs. DM. DM, diabetes mellitus model; DM + A, diabetic rats treated with 5 µg/kg prucalopride; DM + B, diabetic rats treated with 10 µg/kg prucalopride; HuD, RNA-binding protein human antigen D.
IHC
Figure 5 - Immunofluorescence double staining images of Nestin and 5-HT4 in the Control, DM, DM + A and DM + B groups. DAPI-stained nuclei appeared blue. Nestin and 5-HT4 are indicated by red fluorescence and green fluorescence, respectively. A rat model of DM was established using an intraperitoneal injection of streptozotocin. The rats in the Control group were given an equal volume of citric acid solvent. Magnification, ×100. *P<0.05 vs. Control; #P<0.05 vs. DM. DM, diabetes mellitus model; DM + A, diabetic rats treated with 5 µg/kg prucalopride; DM + B, diabetic rats treated with 10 µg/kg prucalopride; 5-HT4, 5-hydroxytryptamine 4.
IHC
Figure 6 - Immunofluorescence double staining images of Nestin and Ki67 in the Control, DM, DM + A and DM + B groups. DAPI-stained nuclei appeared blue. Nestin and Ki67 are indicated by red fluorescence and green fluorescence, respectively. A rat model of DM was established using an intraperitoneal injection of streptozotocin. The rats in the Control group were given an equal volume of citric acid solvent. Magnification, ×100. *P<0.05 vs. Control; #P<0.05 vs. DM. DM, diabetes mellitus model; DM + A, diabetic rats treated with 5 µg/kg prucalopride; DM + B, diabetic rats treated with 10 µg/kg prucalopride.
IF
(C) Identification of NSCs isolated from the hippocampus of embryonic Sprague-Dawley rats. Successful isolation of NSCs was indicated by 98% of the cells being nestin-positive (scale bar, 100 µm).| Application Notes | *Optimal dilutions/concentrations should be determined by the researcher.: ELISA: 1:20000 ~ 1:80000 WB:1:500~1:1000 IHC:1:50~1:100 |
|---|
| Form | Liquid |
|---|---|
| Storage Instructions | Store at +4°C or at -20°C if preferred. Storage in frost-free freezers is not recommended. This product should be stored undiluted. Avoid repeated freezing and thawing as this may denature the antibody. Should this product contain a precipitate we recommend microcentrifugation before use. |
| Storage Buffer | Phosphate buffered saline containing 0.09% Sodium Azide (NaN3) |


